Overview
- 19 Apr 2019
- 2 Minutes to read
- Print
- DarkLight
- PDF
Overview
- Updated on 19 Apr 2019
- 2 Minutes to read
- Print
- DarkLight
- PDF
Article Summary
Share feedback
Thanks for sharing your feedback!
In today’s market a wide range of tools is available to optimize and monitor the performance of an application. AppDynamics is a well-known top application performance monitoring tool when it comes to APM which provides a granular level performance data of your configured environment.BizTalk360 brings integration with AppDynamics.If you are already using AppDynamics now you can view the performance metrics of the BizTalk server environment across multiple dashboards within AppDynamics .
In this section, we will take a detailed look at:
- How does BizTalk360 push the performance data to AppDynamics
- Steps to integrate BizTalk360 with AppDynamics
How does BizTalk360 Push the performance data to AppDynamics?
The BizTalk360 Analytics service includes a sub-service called “AppDynamics” which is responsible to constantly push BizTalk environment's metrics to AppDynamics Agent and send them to a controller ,which process the data and presents them via AppDynamics dashboard.The AppDynamics sub service executes every 70 seconds and checks for the data in the performance data service(another BizTalk360 Analytical sub service).
When BizTalk360 is newly installed / Upgraded the AppDynamics sub service will be in the paused state. You need to manually start the service by navigating to BizTalk360 Settings->Analytics health ->Analytics Service Status->AppDynamics .
AppDynamics provides a windows service called .Net Agent Coordinator that needs to be installed in the server where BizTalk360 Analytics service is running .

Steps to integrate BizTalk360 with AppDynamics
- Step 1: Download and install AppDynamics .NET Agent in the server where BizTalk360 analytics service is running
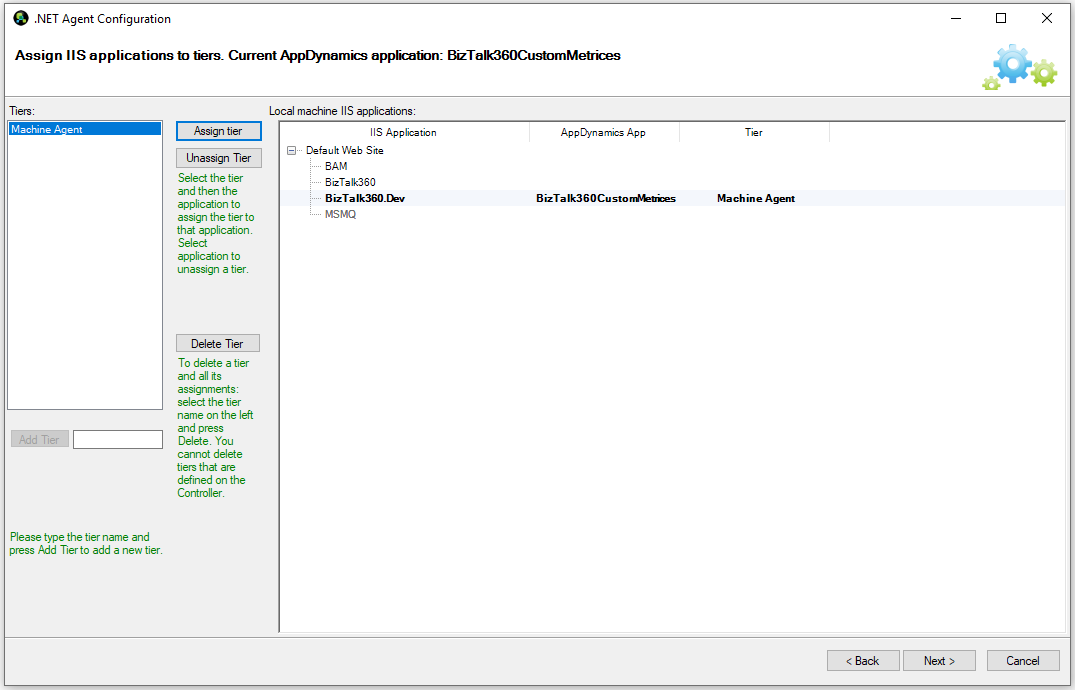
- Step 2: Configure the AppDynamics Agent
Create a tier for your AppDynamics application and assign it to the BizTalk360 Application.
- Step 3: Start the AppDynamics Agent Coordinator service.
You can check the status of the AppDynamics Agent coordinator service. Log into BizTalk360 -> Setting -> Analytics Health ->AppDynamics - Step 4: Start the BizTalk360 Analytics sub service "AppDynamics"
By navigating to Setting -> Analytics Health ->Analytics service ->AppDynamics->Start

- Step 5: Enable the performance counter in BizTalk360 by navigating to BizTalk360 Settings->Analytics Health->Manage Analytics->Enable the required performance data collection for the desired environment .

Now, the BizTalk360 Analytics Service will start pushing the performance metrics counter to AppDynamics Agent. User can view the BizTalk Server analytics data in the AppDynamics metric browser.
Some of the main BizTalk Server Analytical metrics are
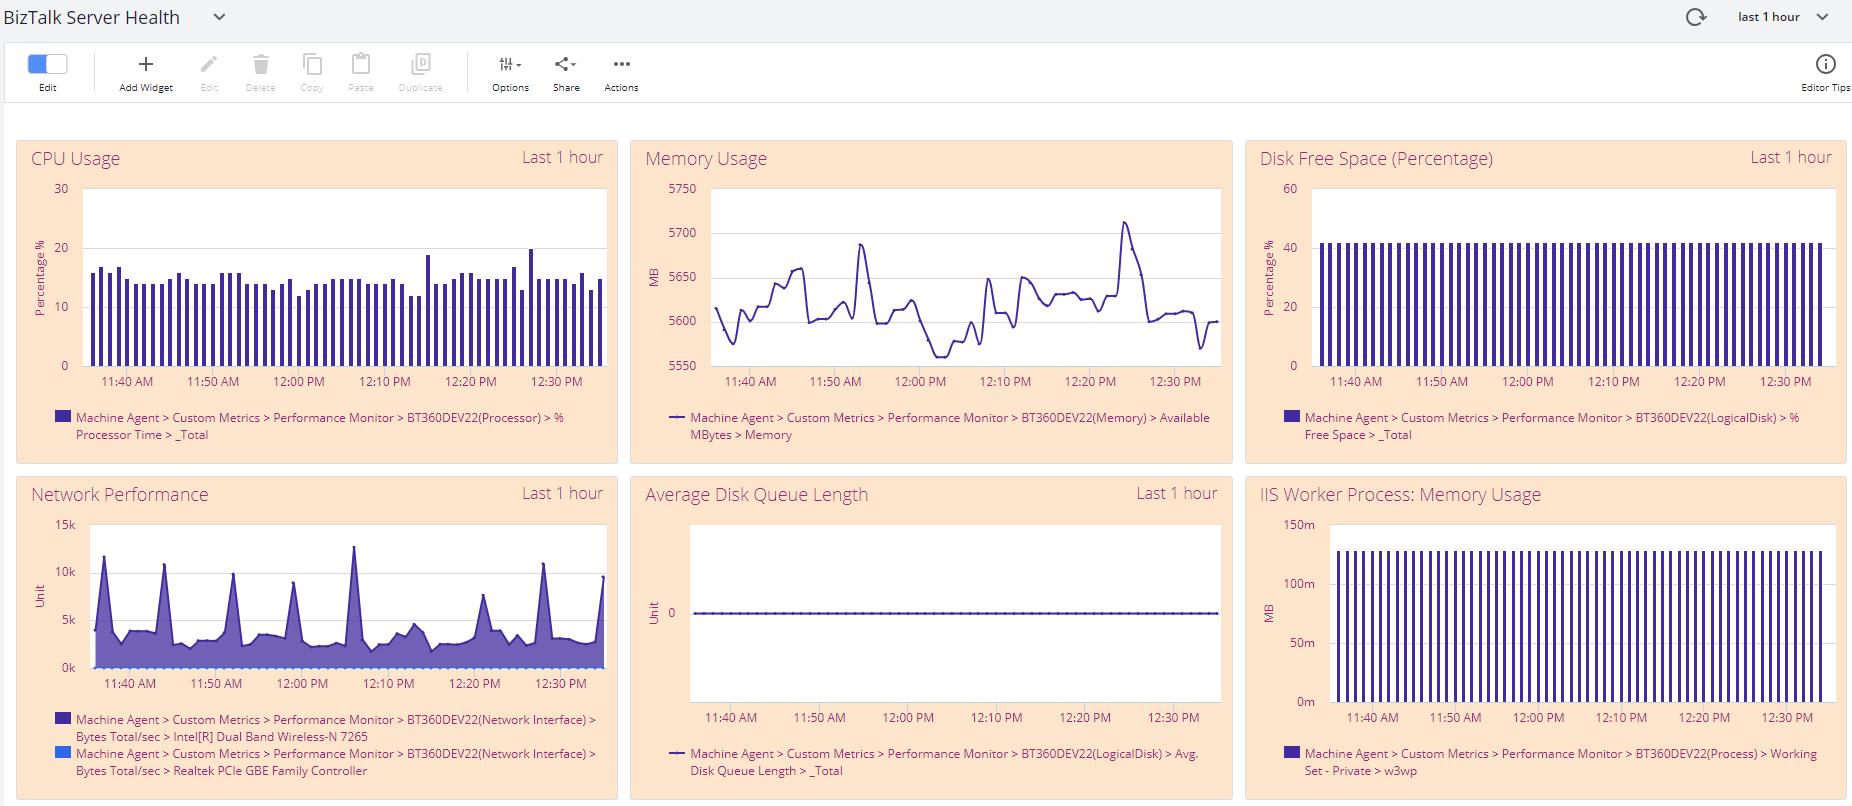
- BizTalk Server Health
- CPU Usage
- Memory Usage
- Disk Free Space (Percentage)
- Average Disk Queue Length
- Network Performance
- IIS Requests per Sec
- IIS Worker Process: CPU Usage
- IIS Worker Process: Memory Usage
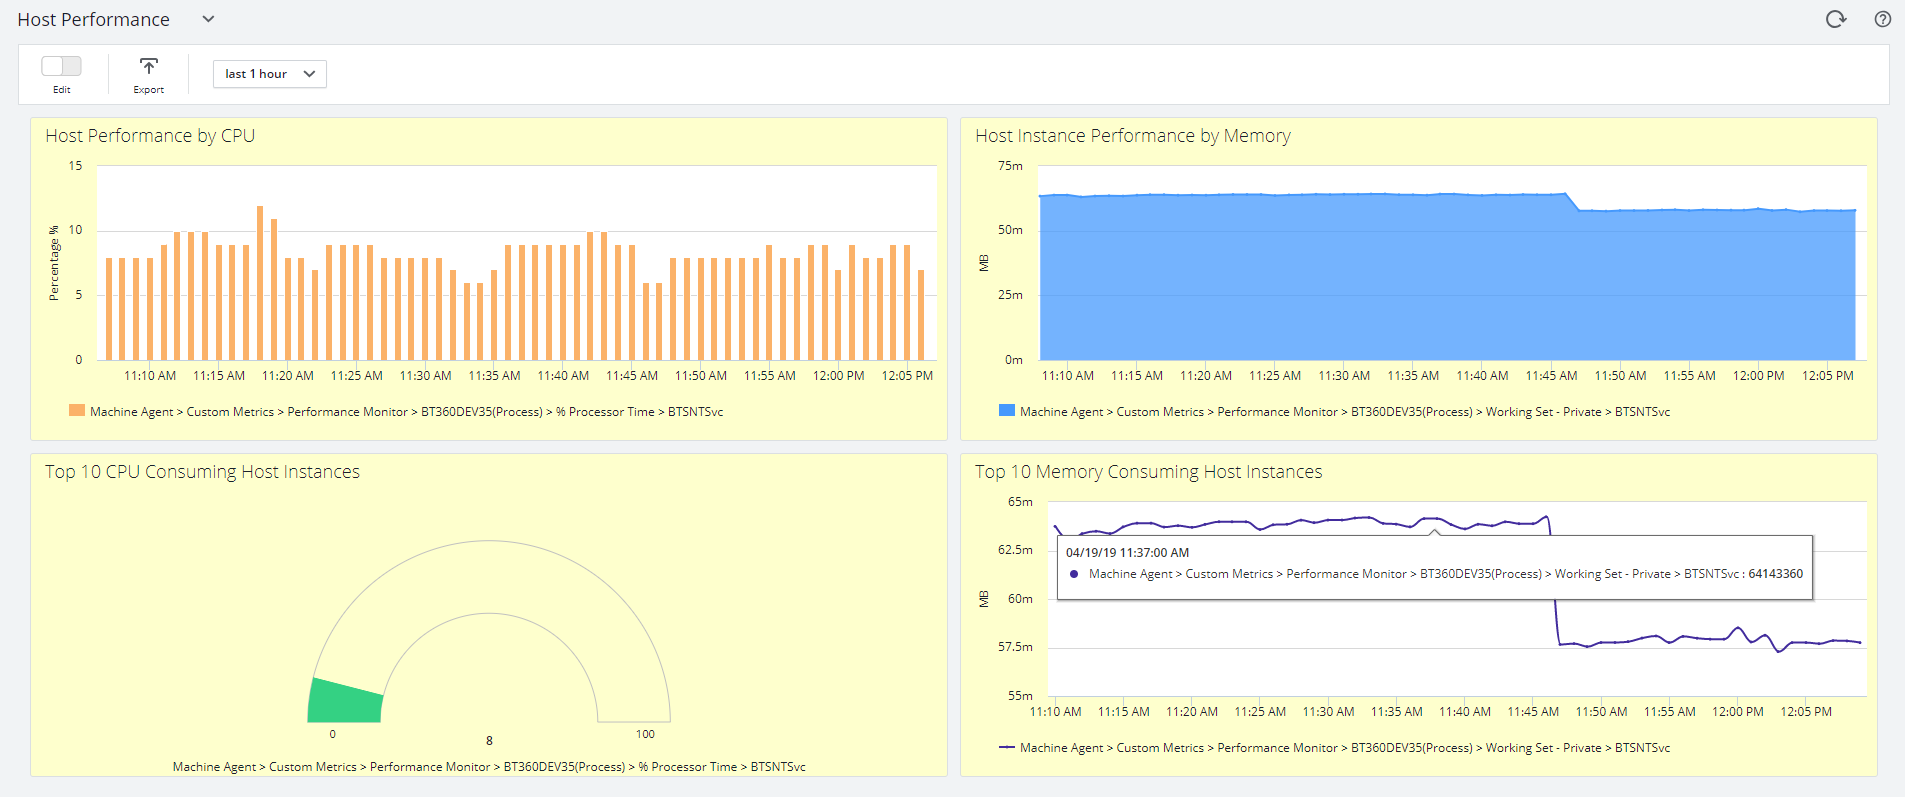
- Host Performance
- Host Instance Performance by CPU
- Host Instance Performance by Memory
- Top 10 CPU Consuming Hosts
- Top 10 Memory Consuming Hosts
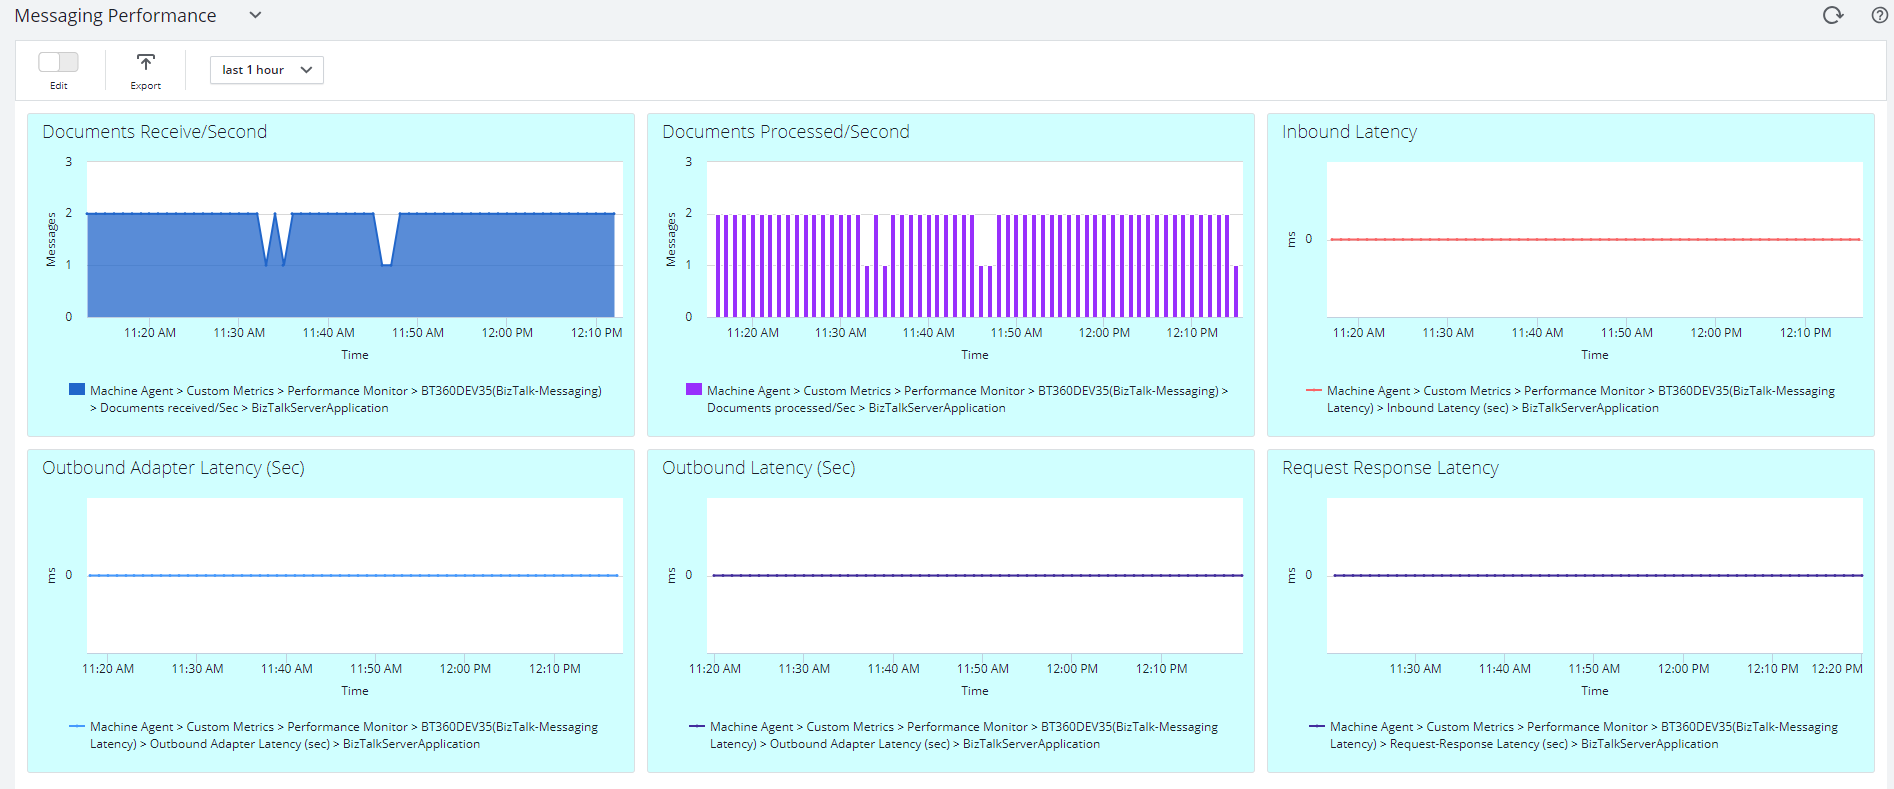
- Message Performance
- Documents receive/Second
- Documents processed/Second
- Inbound Latency (sec)
- Outbound Latency (sec)
- Outbound Adapter Latency (sec)
- Request-Response Latency
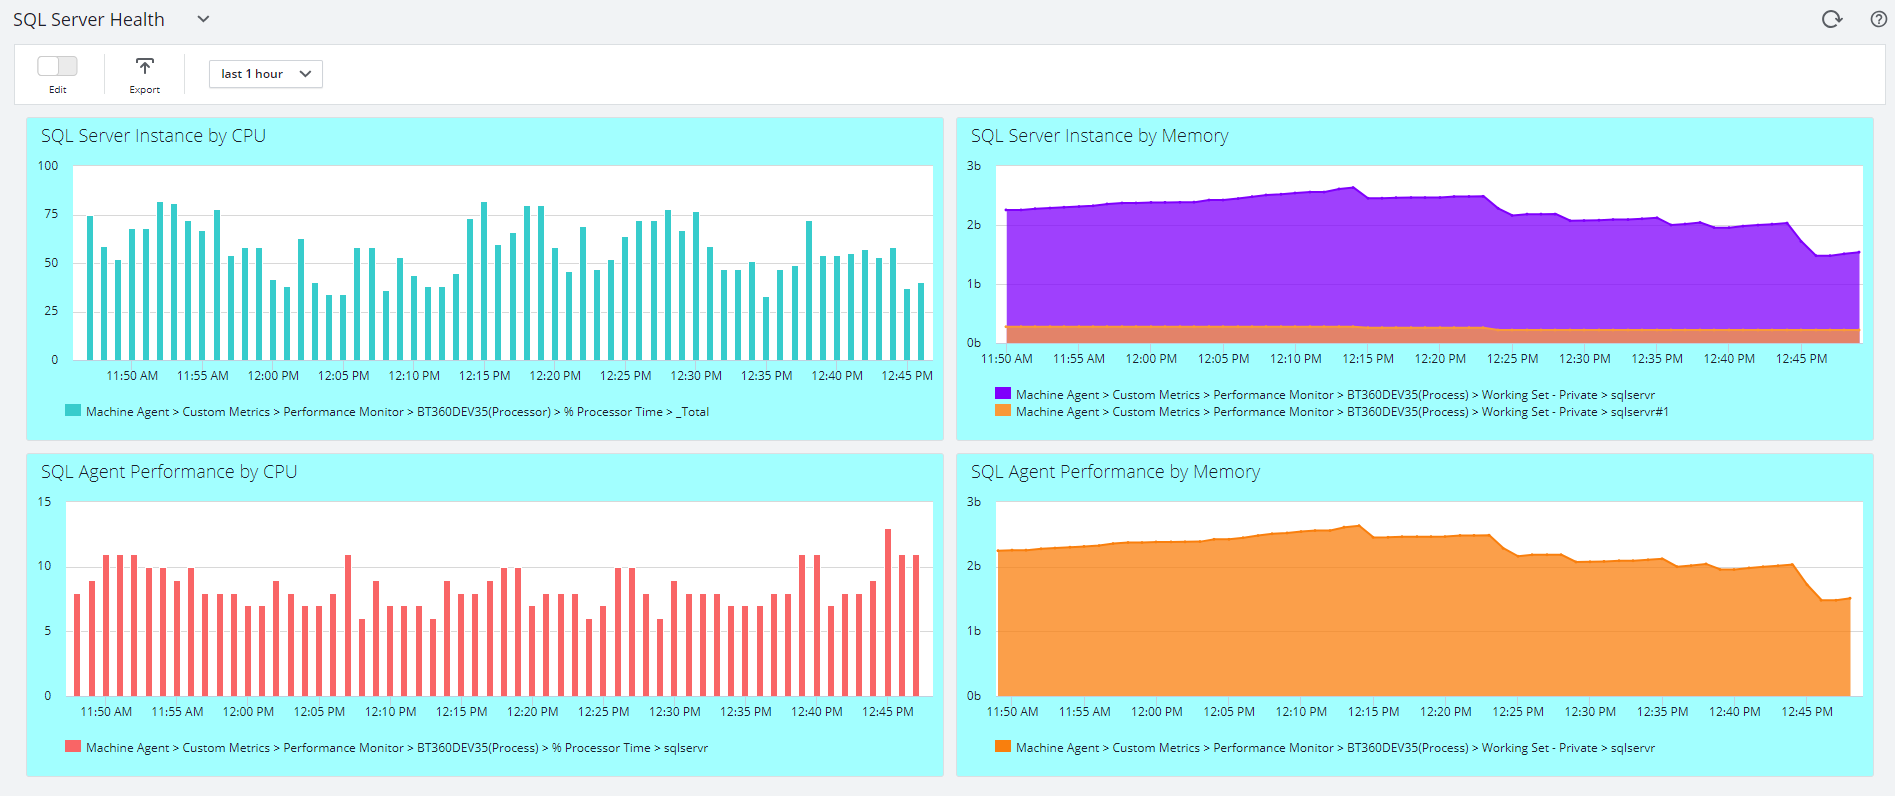
- SQL Server Health
- SQL Server Instances by CPU
- SQL Server Instances by Memory
- SQL Agent Performance by CPU
- SQL Agent Performance by Memory
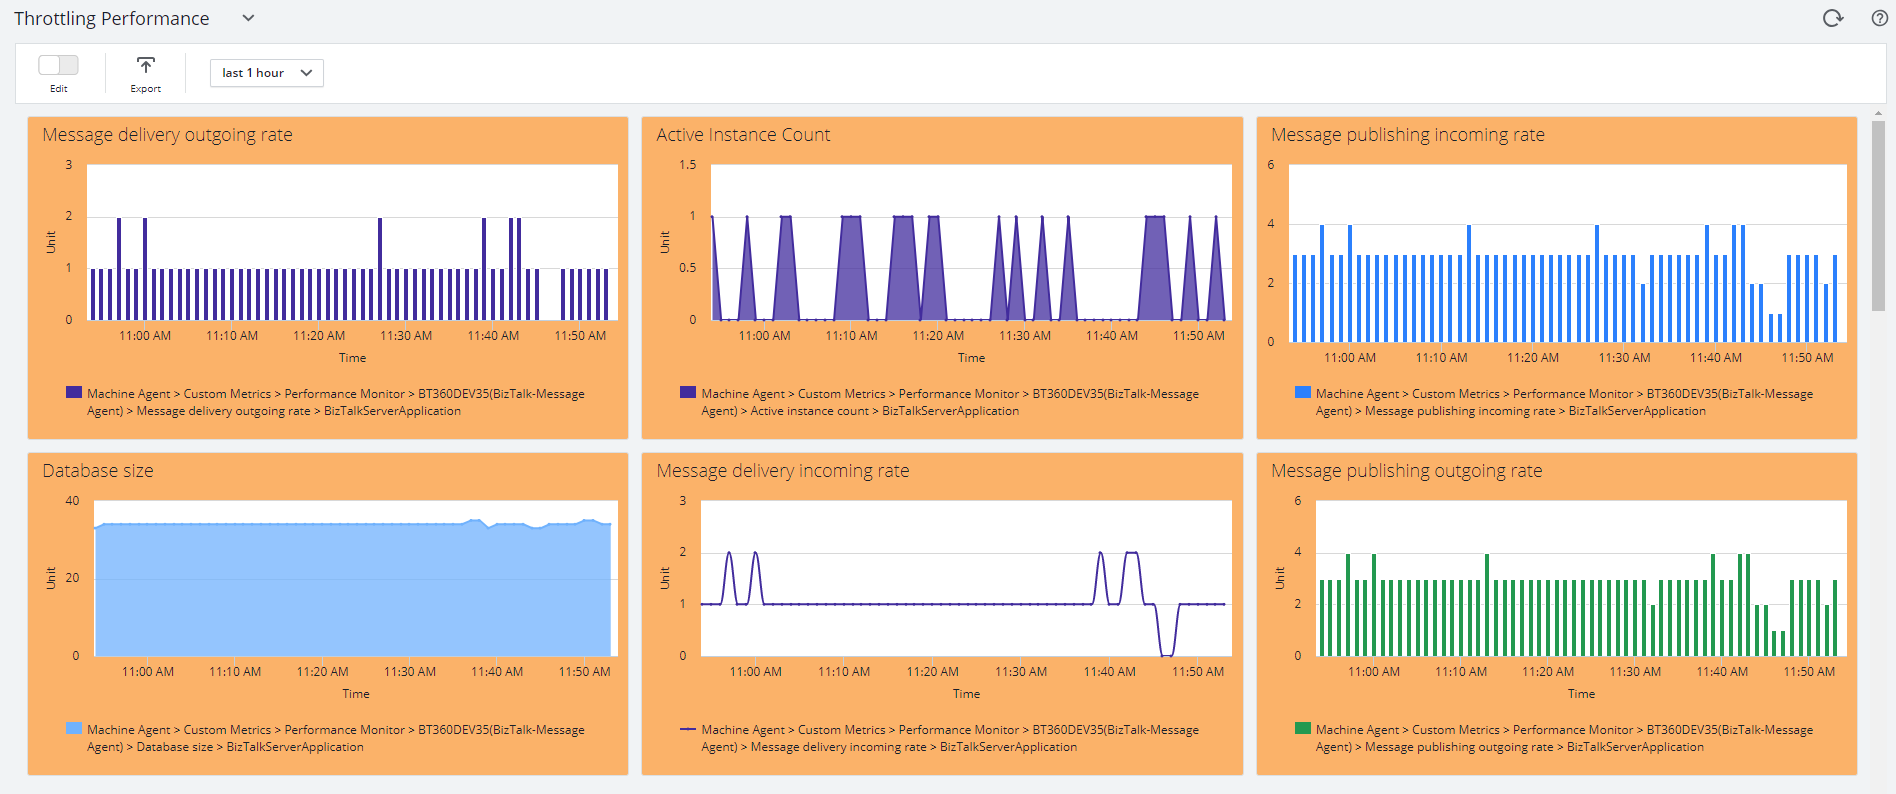
- Throttling Performance
- Message delivery throttling state
- Message publishing throttling state
- Active instance count
- Database size
- Database session
- Database session threshold
- In-process message count
- In-process message count threshold
- Message delivery incoming rate
- Message delivery outgoing rate
- Message publishing incoming rate
- Message publishing outgoing rate
If any new performance counters are introduced, make sure to restart BizTalk360 Analytics Service.
Was this article helpful?