Data Monitoring Dashboard
- 01 May 2018
- 1 Minute to read
- Print
- DarkLight
- PDF
Data Monitoring Dashboard
- Updated on 01 May 2018
- 1 Minute to read
- Print
- DarkLight
- PDF
Article Summary
Share feedback
Thanks for sharing your feedback!
A vital part of Data Monitoring is how can you see the information executed by BizTalk360. For that purpose we provide the Data Monitoring dashboard. The first thing you need to look at is the Calendar view, which will help you understand which data monitoring took place when.
- Red colored days mean that at least one Data Monitor returned an error
- Amber colored days mean that at least one Data Monitor returned a warning
- Green colored days mean that all Data Monitors has run successfully
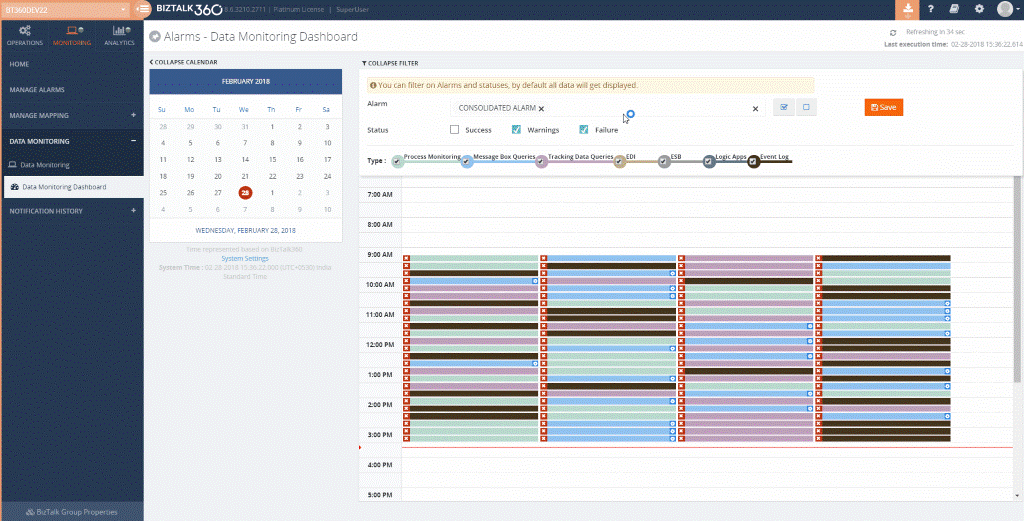
Next, you can click, for example, on one of the days where we had problems. You will see the day calendar view, which lets you understand which data monitoring rules were executed and what was the result. Again, colour coding is used for both the type of query (Process Monitoring, MessageBox Monitoring, Tracking data Monitoring, etc.) and the result of the validation.
Data Monitoring Dashboard Filters
The Data Monitoring Dashboard has an extended filtering feature that allows you to filter on the data monitoring status based on:
- Alarm selection
- Alarm status
- Data monitoring type
When the user is directed to the data monitoring dashboard, by default, all the data will be displayed with the appropriate Status and Monitoring Types being enabled. Users can choose a single or multiple alarms and/or status. Based on the selection, data will be displayed in the dashboard.
The filter settings are saved at the environment level.
If you want to understand what happened for a particular execution, you can click on one of the entries in the day view of the dashboard and below window will be displayed
 Here you can see the day and time for the validation, the warning and error thresholds, the query result count and which filters were applied (the query). You also see the status of the validation (Success, Warning or Error) or if any action was performed. The “Task Result” tab will show all the actions performed (ex resumed/terminated instances and their details).
Was this article helpful?