Overview
- 30 Aug 2019
- 3 Minutes to read
- Print
- DarkLight
- PDF
Overview
- Updated on 30 Aug 2019
- 3 Minutes to read
- Print
- DarkLight
- PDF
Article Summary
Share feedback
Thanks for sharing your feedback!
DynaTrace is an APM tool which has a generic capability to monitor Operating systems, network protocols, system metrics, network infrastructure, application etc . But there is no out of the box Dynatrace plugin or agent for BizTalk Server. This means that the user needs to install an open source plugin Fastpack (which has been updated a couple of years back but is not up to date with the latest BizTalk release) on all the BizTalk Servers running in the environment, along with some configuration changes at BizTalk host instances config file btsntsvc.exe.config.
BizTalk360 brings the integration with Dynatrace. If you are already using Dynatrace, then you can view the performance metrics of the BizTalk server environment as custom metrics across multiple dashboards within Dynatrace.
In this section we will take detailed look at :
- How does BizTalk360 push the performance data to Dynatrace?
- How to configure your Dynatrace environment in BizTalk360
- Viewing BizTalk360 Analytical Data in Dynatrace
How does BizTalk360 pushes the performance data to Dynatrace
Unlike other tools BizTalk360 doesn’t need any agent to be installed in the BizTalk server(s) to collect the performance data and also it does not require any configuration changes at server level.
The BizTalk360 Analytics Service holds a subservice for Dynatrace which is responsible for pushing the analytics data from BizTalk360 to Dynatrace . The Dynatrace subservice creates custom metrics in your Dynatrace environment for all the counters which you have enabled in the BizTalk360 analytics configuration section. Each minute, the subservice will push the collected BizTalk Server performance data to the respective custom metrics. These custom metrics data can be mapped to a custom chart and viewed in your Dynatrace dashboard.
In Dynatrace you have only 100 custom metrics available for free per environment. If you want to view more than 100 performance counters, then you need to purchase the custom metrics for the same from DynaTrace
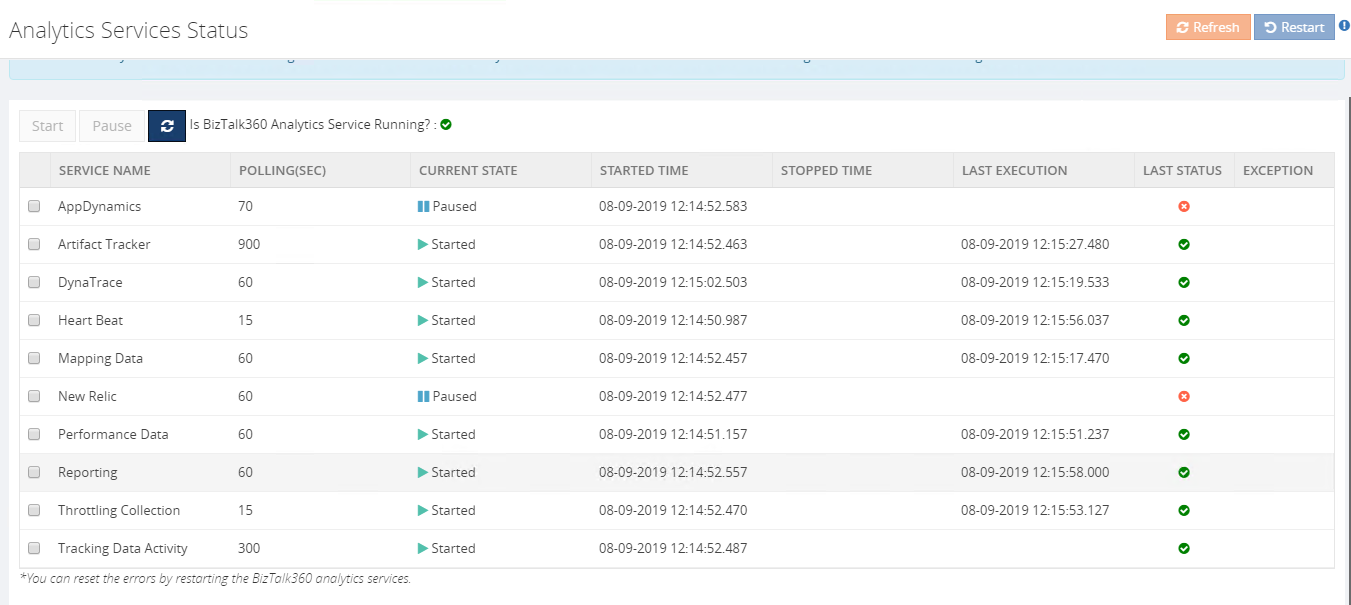
By default, when you install/upgrade BizTalk360, the Dynatrace subservice (under Analytics Services) will be in the Paused state. You need to manually start this service after configuring the Dynatrace environment details in BizTalk360. This is an important step. Without performing this step, you will not be able to view the BizTalk360 analytics data in Dynatrace.
BizTalk360 uses Dynatrace exposed TimeSeries API's–' Custom Metrics' and 'Post data point' to push the performance data to the configured Dynatrace environment .
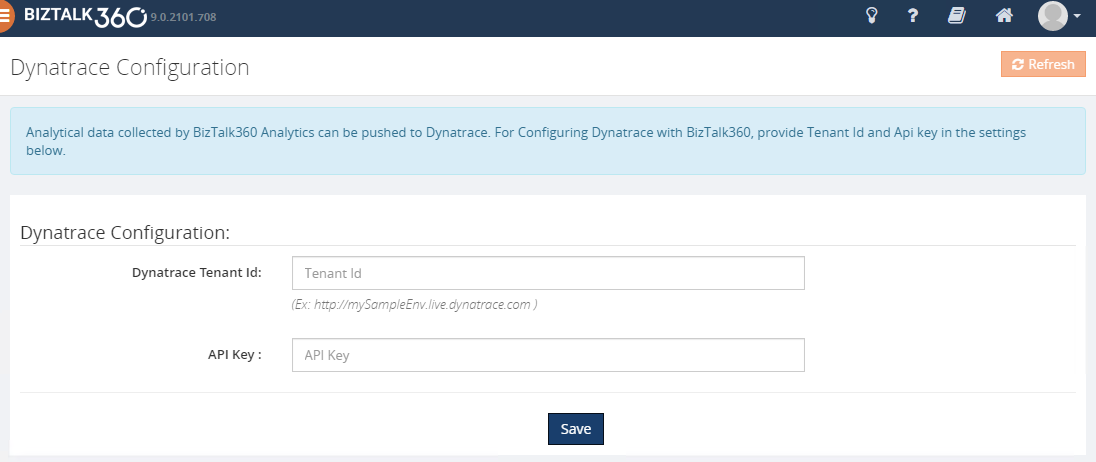
How to configure DynaTrace Environment details in BizTalk360
You can easily configure your Dynatrace environment in BizTalk360, by providing your Dynatrace environment details such as tenant id and API key in the Dynatrace configuration section under (BizTalk360 Setting -> Analytics Configuration).
Viewing BizTalk360 Analytical Data in Dynatrace
- Log into your Dynatrace Environment
- Create a custom chart widget in the dashboard
- Configure the custom chart by selecting performance categories, say BizTalk Messaging Performance, Failure Rate, Processor, etc. and select the respective custom metrics
You will start seeing the analytical data of the mapped custom metrics in the dashboard.
Below are some of the important performance metrics you can see in your Dynatrace dashboard.
BizTalk and SQL Server Health
- CPU Usage
- Memory Usage
- Disk Free Space
- Average Disk Queue Length
- Network Performance
- IIS Request Per Sec
- IIS Worker Process: CPU Usage
- IIS Worker Process: Memory Usage
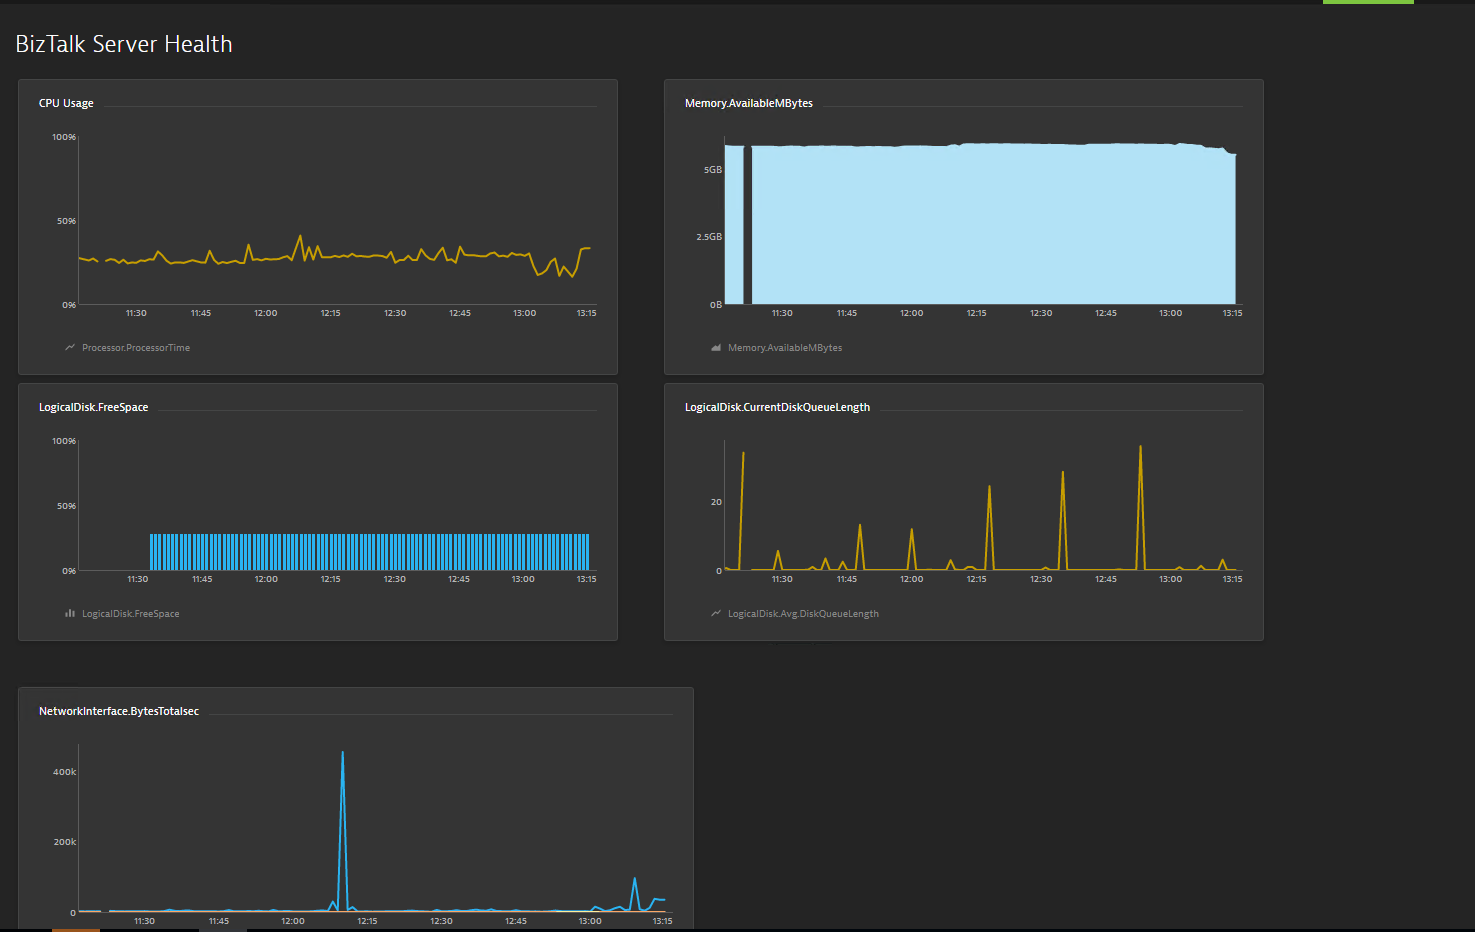 {height="" width=""}
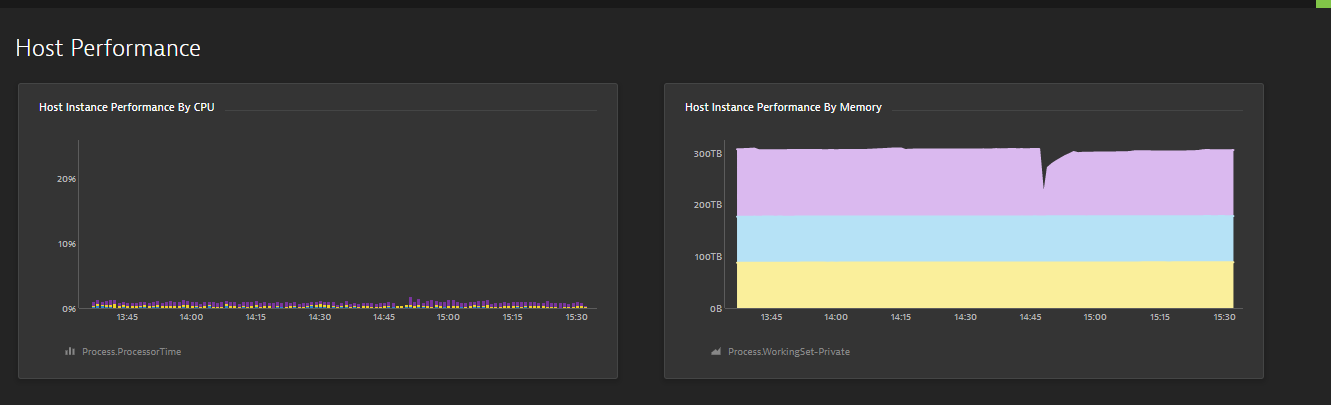
Host Performance
- Host Instance performance by CPU
- Host Instance Performance by Memory
- CPU Consuming Host Instances
- Top 10 Memory Consuming Host Instances

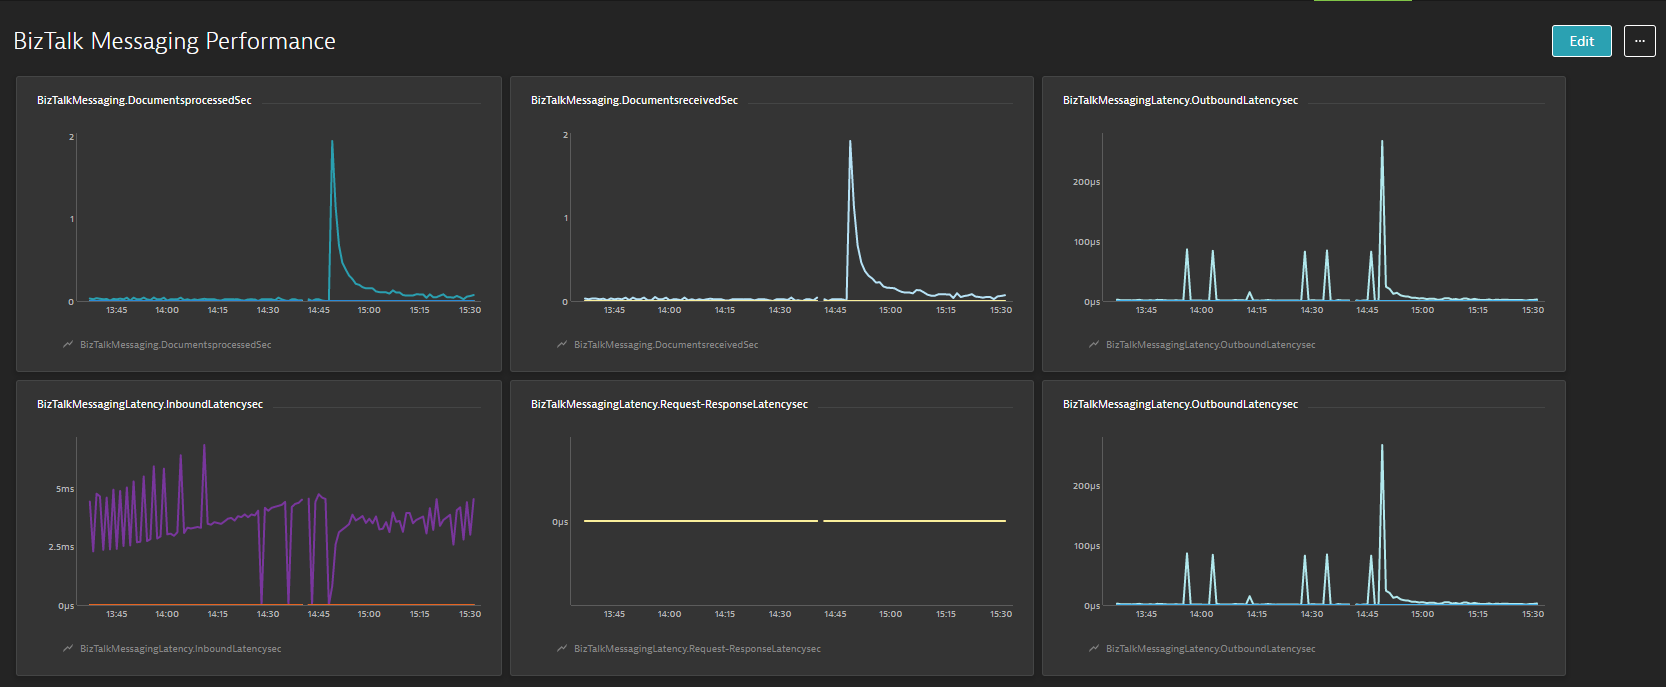
BizTalk Messaging Performance
- BizTalk Host Performance
- Documents Receive/Second
- Documents Processed/Second
- Inbound Latency (Sec)
- Outbound Latency (Sec)
- Outbound Adapter Latency (Sec)
- Request -Response Latency
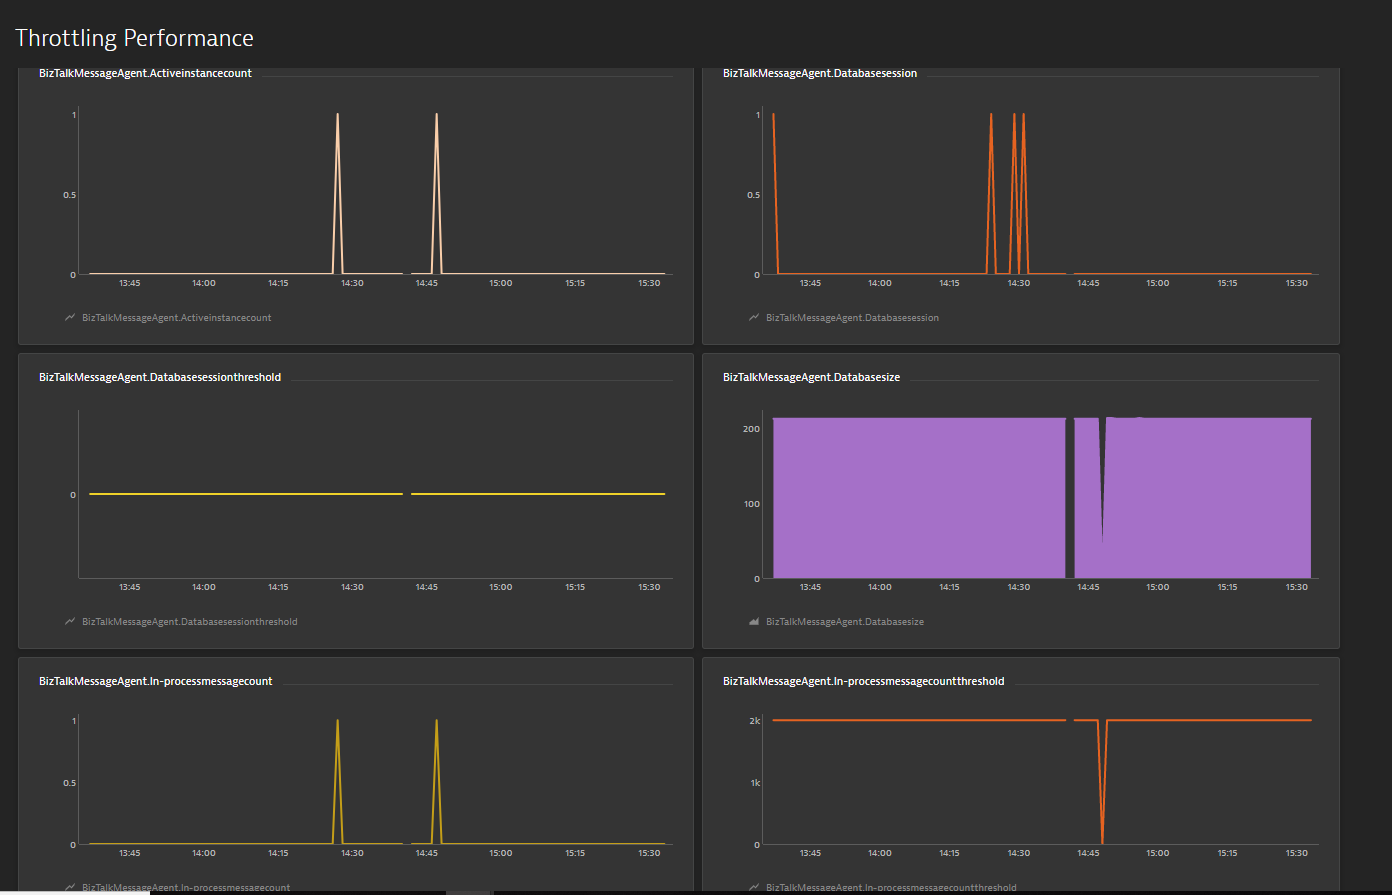
Throttling Performance
- Message delivery Throttling State
- Message Publishing Throttling State
- Message Delivery Outgoing Rate
- Message Delivery Incoming Rate
- Active Instance Count
- Database Size
- Database Session
- Database Session Threshold
- In-Process message Count
- In-Process Message Count threshold
- Message publishing incoming Rate
- Message Publishing Outgoing Rate

Was this article helpful?