Understanding BizTalk360 Throttling Analyser
- 12 Mar 2021
- 3 Minutes to read
- Print
- DarkLight
- PDF
Understanding BizTalk360 Throttling Analyser
- Updated on 12 Mar 2021
- 3 Minutes to read
- Print
- DarkLight
- PDF
Article Summary
Share feedback
Thanks for sharing your feedback!
This section gives some more insight into the BizTalk360 Throttling Analyser. It is divided into the following parts:
- What is the purpose of the BizTalk360 Throttling Analyser
- How to Start/Pause the Throttling Performance Counters Collection Service
- How to disable access to the Throttling Analyser
- For how long will the throttling performance data be stored
What is the purpose of the BizTalk360 Throttling Analyser
The Throttling Analyser in BizTalk360 helps to overcome the following challenges:
- Throttling is difficult to understand. Experienced BizTalk professionals too sometimes face challenges in understanding the huge volume of raw data provided by the BizTalk Server
- BizTalk Server only provides raw performance counter data. There are no visual tools to understand them better
- Traditional performance monitoring tools like PerfMon, for example, are not suited for monitoring throttling
- Enterprises don't monitor throttling conditions in real-time. Before moving the system to production, enterprises do a lot of performance testing, monitor and tune the system. While in production, the scenario is different
Synthesizing performance counter data and correlating various parameters is difficult and a challenge in terms of effort to an integration expert too. The goal is to give a visual cue of what is happening in the environment in a near real-time condition.
How To Start/Pause Throttling Performance Counters Collection Service
BizTalk360 comes with an Analytics service that is responsible for collecting the required throttling performance counter data from various servers in the environment. It understands the host/host instances configuration and periodically collects the required performance counter data and stores it in the BizTalk360 database. The default collection time is 15 seconds. The collection algorithm is optimized so that it will not collect unnecessary information. The data is persisted for 7 days, users will not be able to modify it.
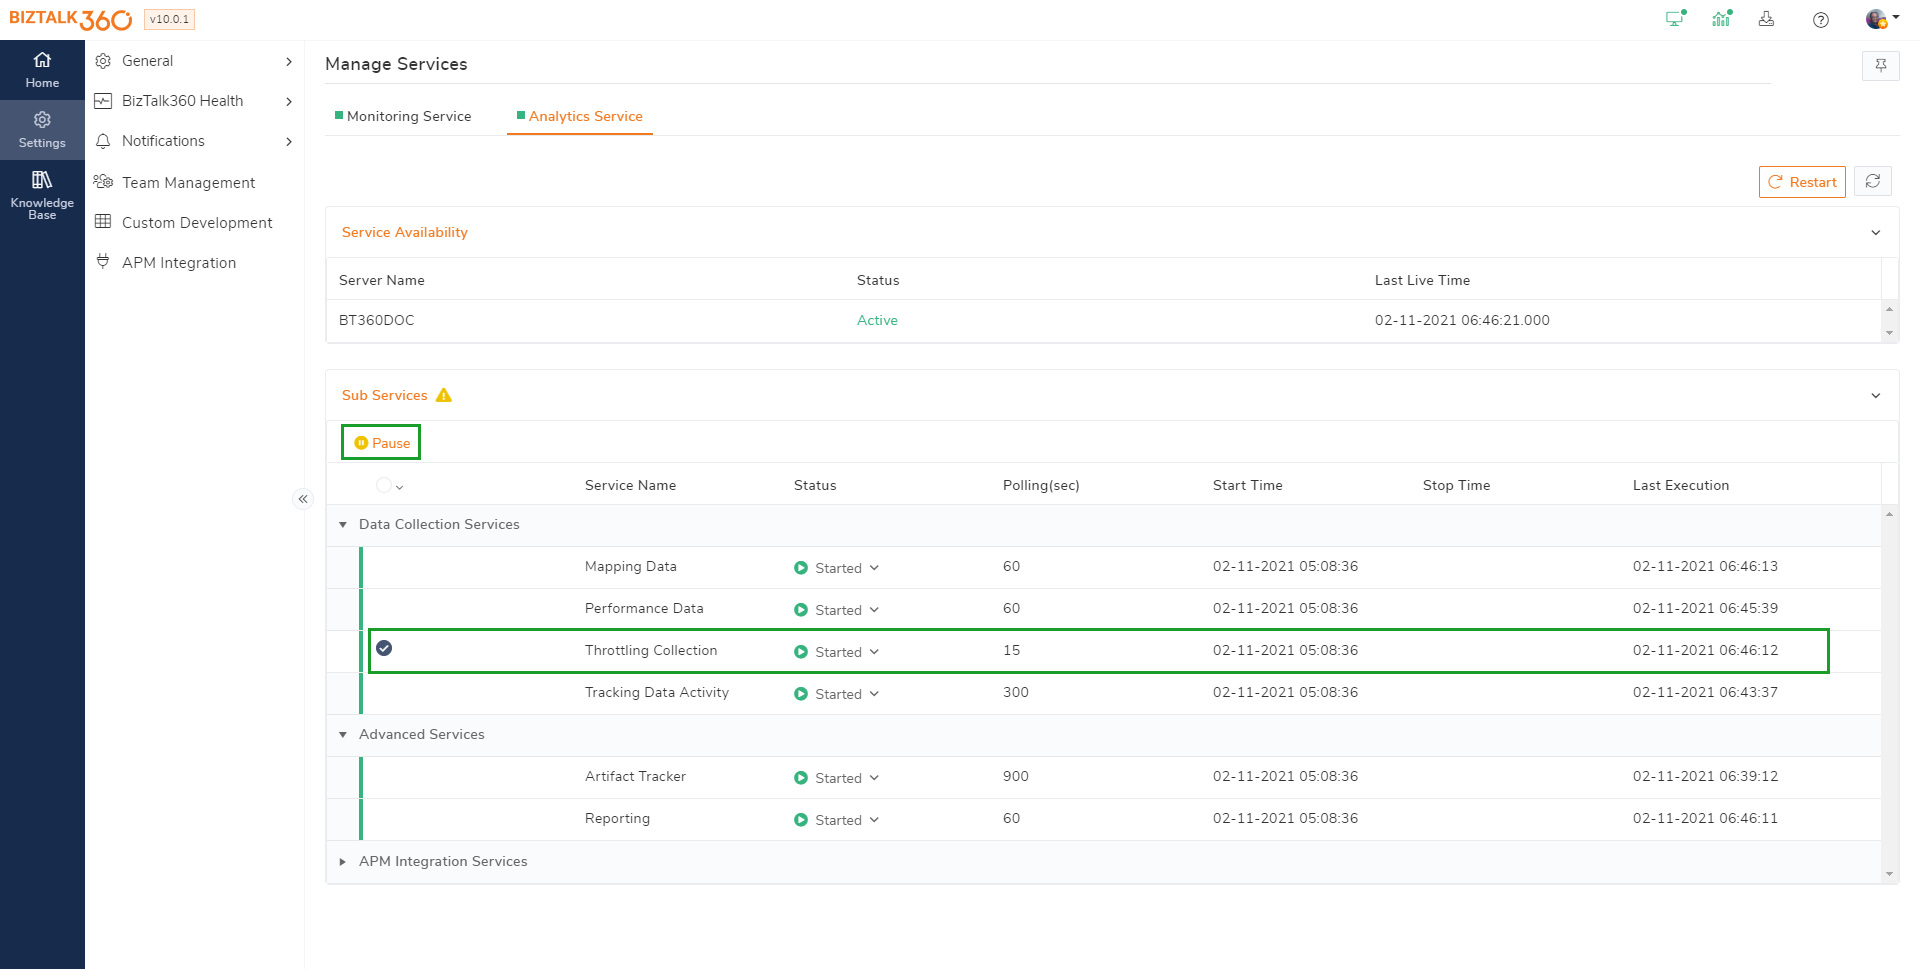
The Throttling Analyser can be found under the Analytics tab. The service status of Throttling Analyser can be accessed from Settings -> BizTalk360 Health -> Manage Services -> Analytics Service -> Sub Services. To read more about Analytics click here.
This throttling collection service can be started or paused as needed.
- Click the Settings icon on the top left of the page. This navigates to the BizTalk360 Settings page
- Click BizTalk360 Health in the left menu bar
- Select Manage Services under BizTalk360 Health
- Navigate to the tab Analytics Services and expand the menu Sub Status
- In the list, select Throttling Collection service and click Start / Pause as needed
- In BizTalk360, the user can perform the required operation in 2 different ways:
- Selecting the service (check box) and clicking on the Operation buttons (Start/Pause) at the top of the grid
- Selecting the status (drop-down button). When you do this, you will notice an inline operation showing up right next to the drop-down with the possible operations that you can perform on the service.
The below screenshot shows the sub-service.
How to disable access to the Throttling Analyser
The Throttling Analyser feature is available for all super users of the BizTalk360 application. Access to this feature can be provided or restricted to non-superusers through the Team Management (User Access Policy) settings.
Follow the steps below to enable or disable access to Throttling Analyser for a normal user:
- Click the Settings icon on the top left corner of the page. This navigates to the BizTalk360 Settings page
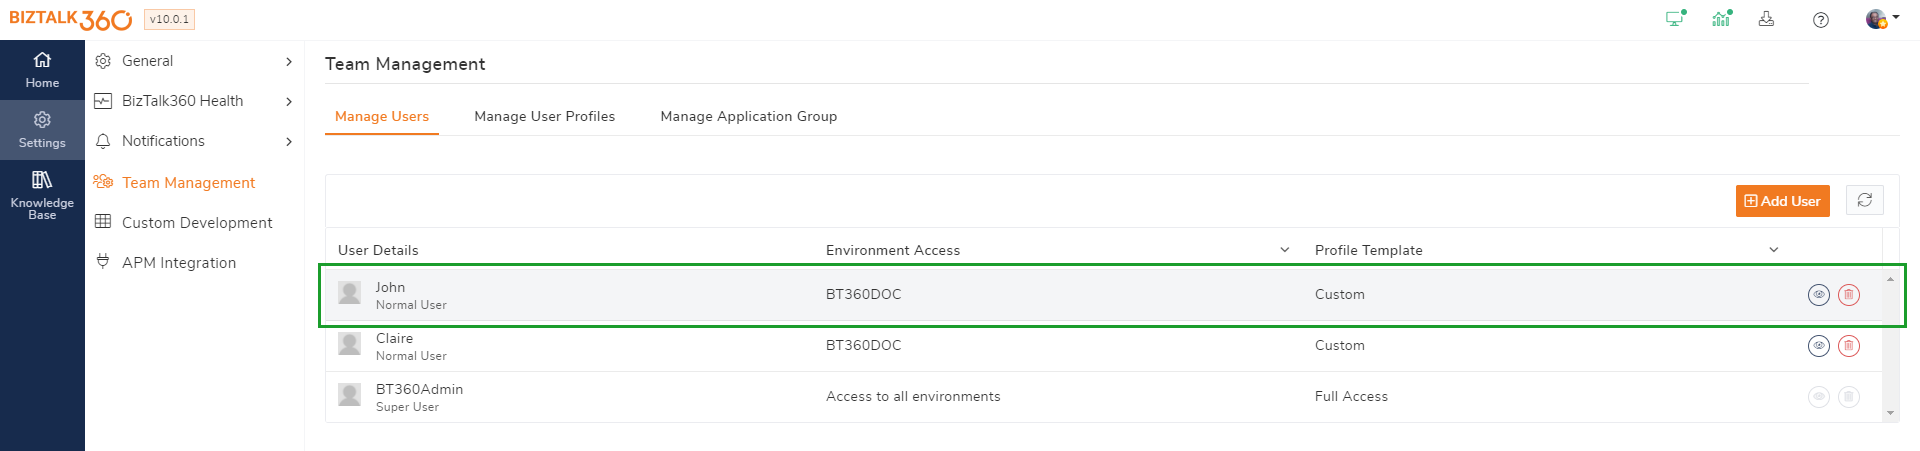
- Click Team Management (User Access Policy) in the left menu bar. This navigates to the User Access Policy - Settings Screen and the users configured for the BizTalk360 application will be listed
- To select a user, within the grid click on a row of a normal user
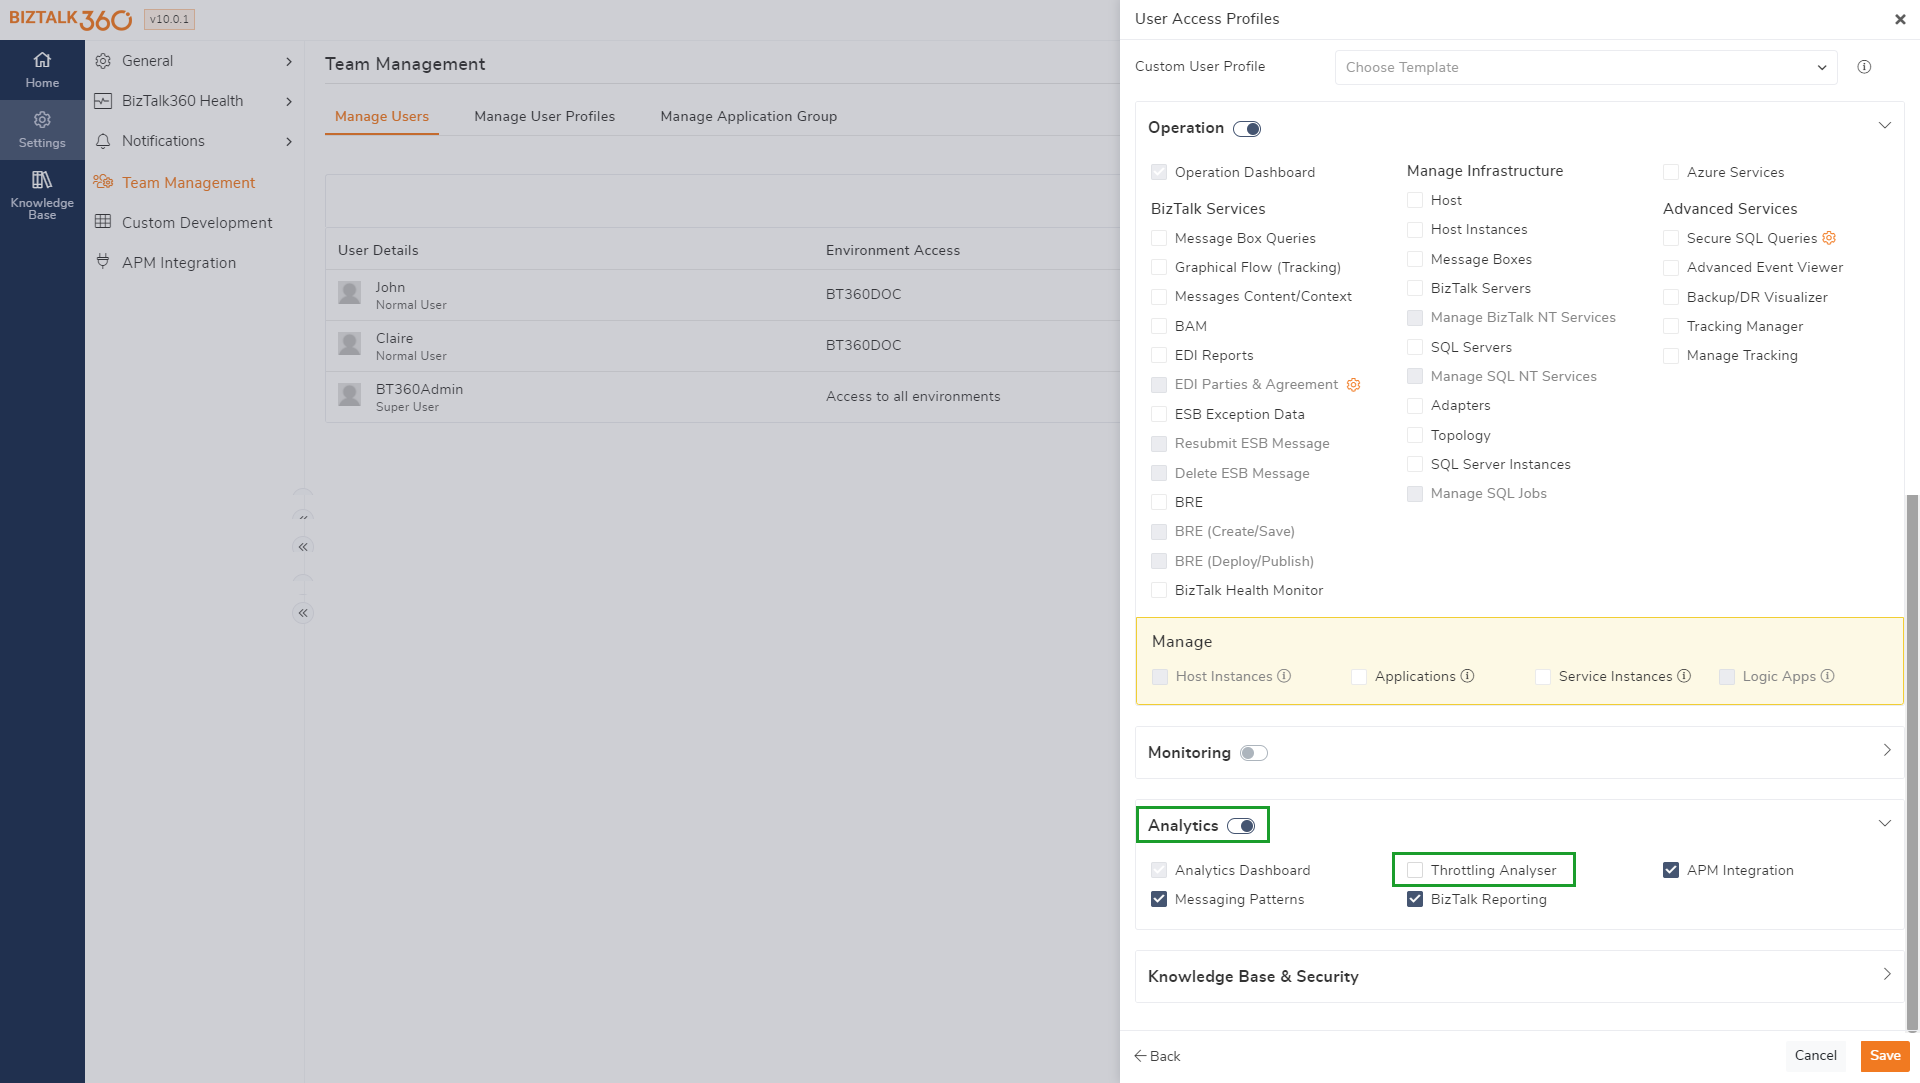
- A blade will be displayed. Navigate to the Add Permissions sections
- Turn on the Analytics section, check/uncheck Throttling Analyser to modify the access
- Click Save
The same can be done for a new user and modify multiple users together by selecting one or more normal users. The below screenshot shows you how to perform the above tasks.
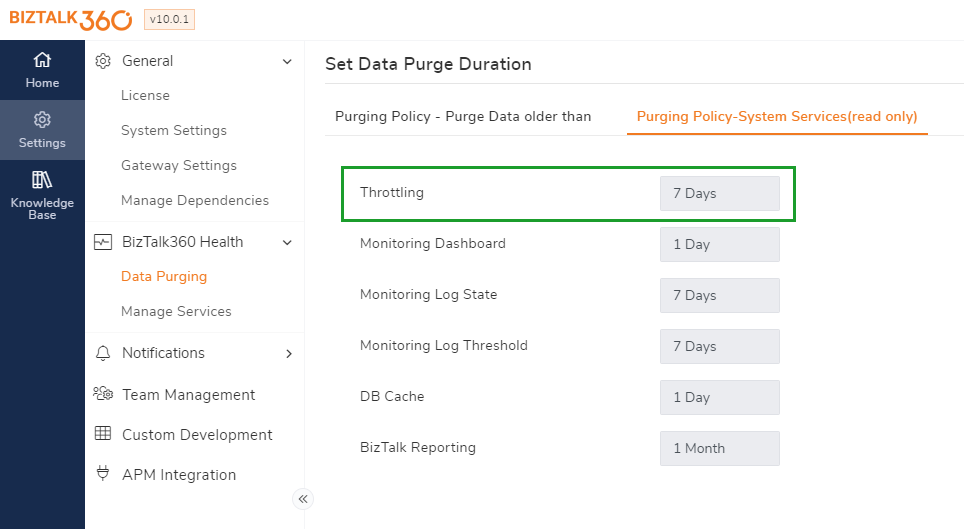
For how long will the throttling performance data be stored
The throttling performance counter data is stored for 7 days. After this period, the data will be automatically purged.
Was this article helpful?