Data Monitoring
- 14 May 2024
- 3 Minutes to read
- Print
- DarkLight
- PDF
Data Monitoring
- Updated on 14 May 2024
- 3 Minutes to read
- Print
- DarkLight
- PDF
Article summary
Did you find this summary helpful?
Thank you for your feedback
Introduction
Data Monitoring allows you to monitor on the data points within your BizTalk Group, for certain events to happen or not to happen. To make this a bit clearer, let's think of below example.
Say, every Monday morning between 9:00 AM and 10:00AM you expect a batch of at least 50 messages from SAP to arrive and being processed in BizTalk. If this batch doesn't arrive in BizTalk, downstream systems won't be updated which results in a breach of your business process.
From a bit more technical perspective, to have this kind of monitoring in place, you would have to monitor the messages which are processed by a particular Receive Port/Location, on Monday between 9:00 AM and 10:00 AM. Because of that, in this scenario the monitoring would take place based on the Tracking data in BizTalk.
Types of Data Monitoring
Besides the Tracking data, BizTalk360 provides monitoring of more data points. See below list of the current data points:
- Process Monitoring
- Message Box
- Business Activity Monitoring (BAM)
- Electronic Data Interchange (EDI)
- Enterprise Service Bus (ESB)
- Logic Apps
- Event Log
- Performance
- SQL Query
The way it works is by allowing you to define how do you want to monitor data in each of these sources by defining:
- Basic Details – we need to associate the data monitoring with an Alarm (a logical container of monitoring rules, see more about it here) and provide a name for identification purposes.
- Data Filter – allows you to define the query you want to monitor, by selecting from the available queries and allows you to filter the result set to your needs.
- Notification Condition – the result from the query will be evaluated against configurable thresholds. In case of a threshold violation, you will be notified via email and the information will also be made available on the Data Monitoring Dashboard
- Monitoring Times – this is where you can specify how frequently you want to run this validation (Daily/Weekly/Monthly), When you want to run i.e. all day or only during specific business hours, then how long and how frequently within the day (Business hours within the day and frequency within the day).
Date/time filters – this option allows you to choose if you want to run the query with a date time filter on one of the date time columns available for the query type which allows you to either look at the overall result of the query or to the time slot being tested.
Business Hours - Users are allowed to configure business start and end time under environment settings. This business hour will automatically reflect in the Data Monitoring schedule creation.
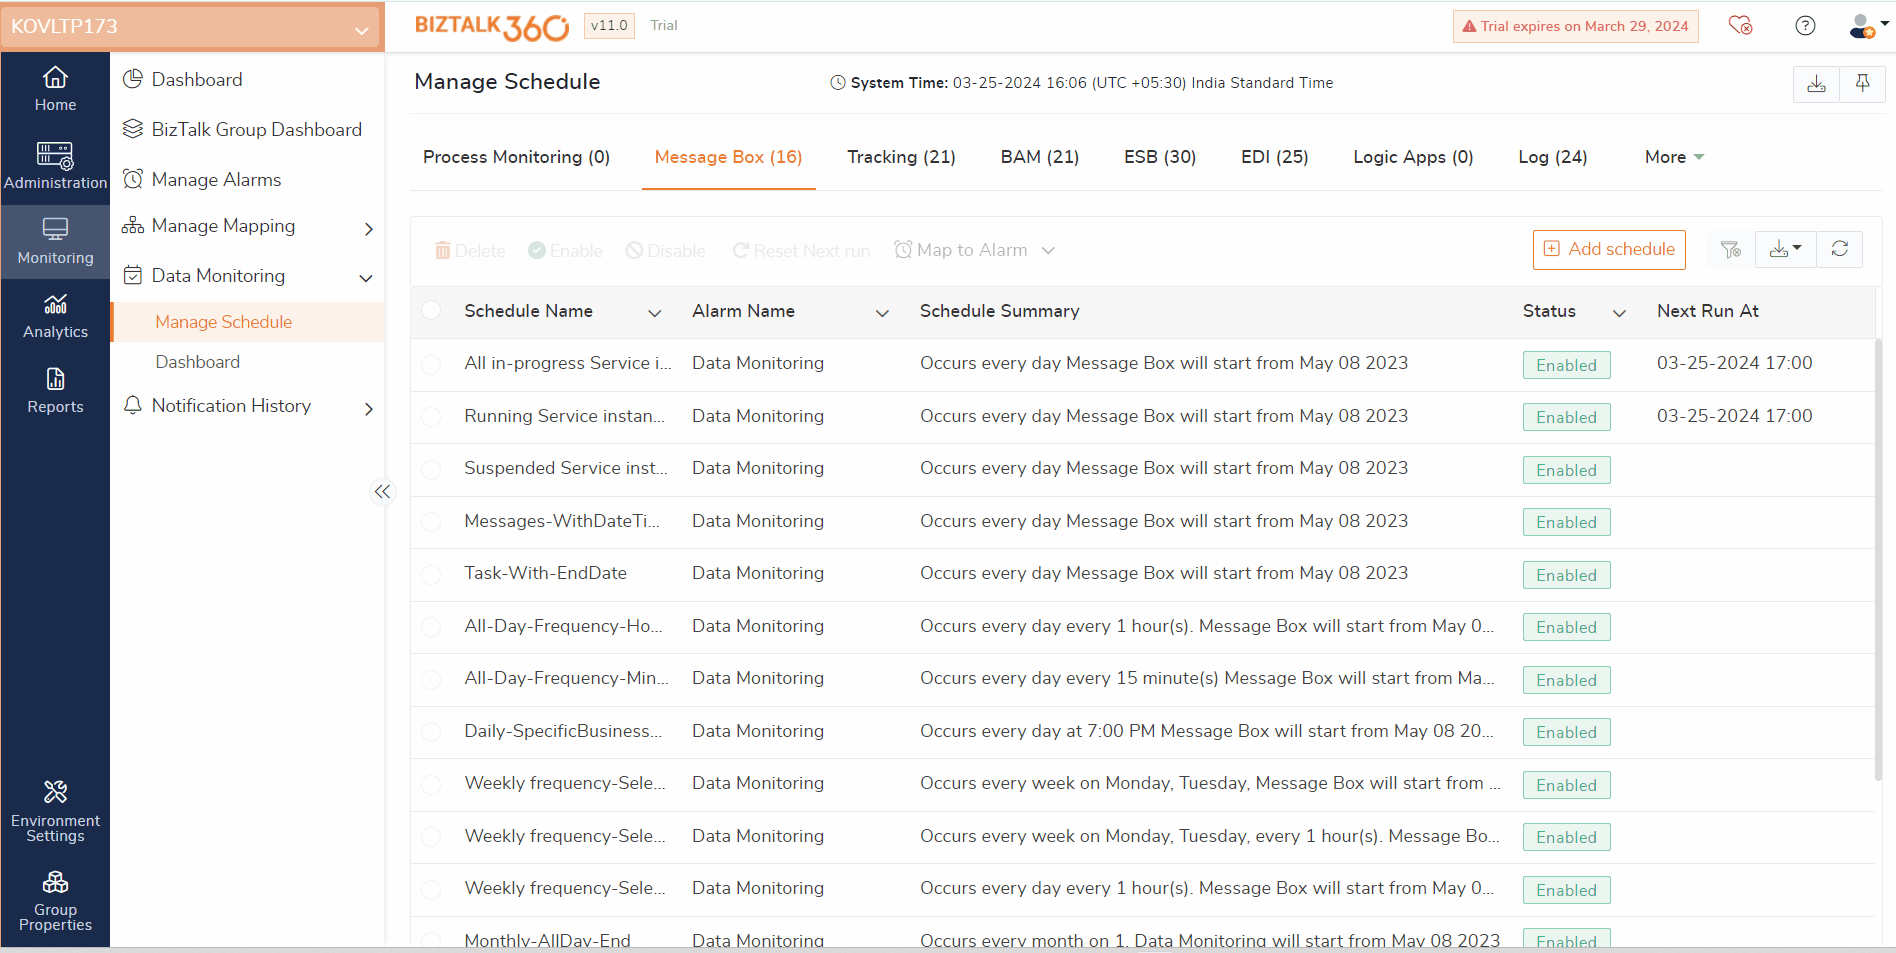
So, this is how we describe a Data Monitoring rule. The monitoring service will then execute the queries periodically, validate it against the error/warning thresholds and it will alert accordingly (email, SMS etc.). The results are also saved into the Data Monitoring Dashboard (this is a calendar-based dashboard where you can see a month and day view, which shows a visual representation of the executions). In the month view of the calendar, you will be able to see on which days there were data monitoring problems and by clicking on a particular day you will see, on the day view of the calendar dashboard, the data validations for that day.
Map Data Monitoring Schedules to an Alarm
Assume a scenario, where the user wants to delete an alarm. The alarm has certain artifacts mapped for monitoring and also data monitoring schedules mapped. The user wants to delete an alarm along with its associated artifact mappings but wishes to keep the existing data monitoring schedules intact. If the user deletes the alarm, all the data monitoring schedules associated will also get deleted. In such scenarios users can utilize the "Map Data Monitoring schedules to alarm" feature. This functionality allows users to maintain their data monitoring schedules even after deleting the alarm and its artifact mappings.
Users have the option to choose specific data monitoring schedules and then click on "Map to Alarm." Afterward, they can select the alarm they want to associate the data monitoring schedules with. This action effectively links the selected data monitoring schedules to the chosen alarm. Consequently, users can safely delete the previous alarm, knowing that their existing data monitoring schedules are now mapped to the new alarm.
Users can view the data monitoring schedules associated with an alarm by accessing the alarm configuration settings. This allows them to see which data monitoring schedules are linked to a particular alarm.
Note:
Deleting alarm(S) will also delete the associated Data Monitoring Schedules.
Was this article helpful?