What is the purpose of Event Log Data Monitoring?
Event logs are files that record the specific events that happen within the environment. The event logs are normally used to inform about important events in the running applications and subsystems such as errors, warnings, or information. The event log information can be used by administrators for troubleshooting problems. BizTalk360 offers administrators the functionality to set filters in event log data monitor on both BizTalk server and SQL server and configure rules based on their requirements. You can configure alerts for a particular event log/source(s) by defining a filter condition on the available event logs and request to be alerted when there are more than a specific number of alerts/warnings from the server.
For e.g., the administrator can set up a monitoring alarm like "Check the BizTalk server monitoring service every 30 minutes on all days in a week and warn me when the event id 5410 (BizTalk Server event) occurs more than 100 times and throw an error when the same event id occurs more than 200 times ". By setting up this alarm, whenever the event id 5410 occurs more than 100 times during a specific 30-minute time interval period, the administrator will receive a warning email notification (with the status as "Warning") from BizTalk360 explaining the current situation. If the value is less than 100, the administrator will receive email notifications with the status as "Success".
By setting up these alarms & notification mechanisms, the need to often log in to the BizTalk360 application and check for specific events becomes eliminated.
Setting up an Event Log Data Monitor
Follow the steps as shown below to create an Event Log Data Monitoring alarm.
- In case you did not do it earlier, follow the steps as mentioned in this section to create a Data Monitoring alarm
- Select the Use this alarm for Data Monitor Alerts checkbox to map the current alarm to Data Monitors. Only when this option is selected, the Notify on Success as well checkbox gets activated.
- The Notify on Success as well checkbox is optional for Data Monitoring, while the Use this alarm for Data Monitor Alerts option is mandatory.
- Click OK to save the alarm information.
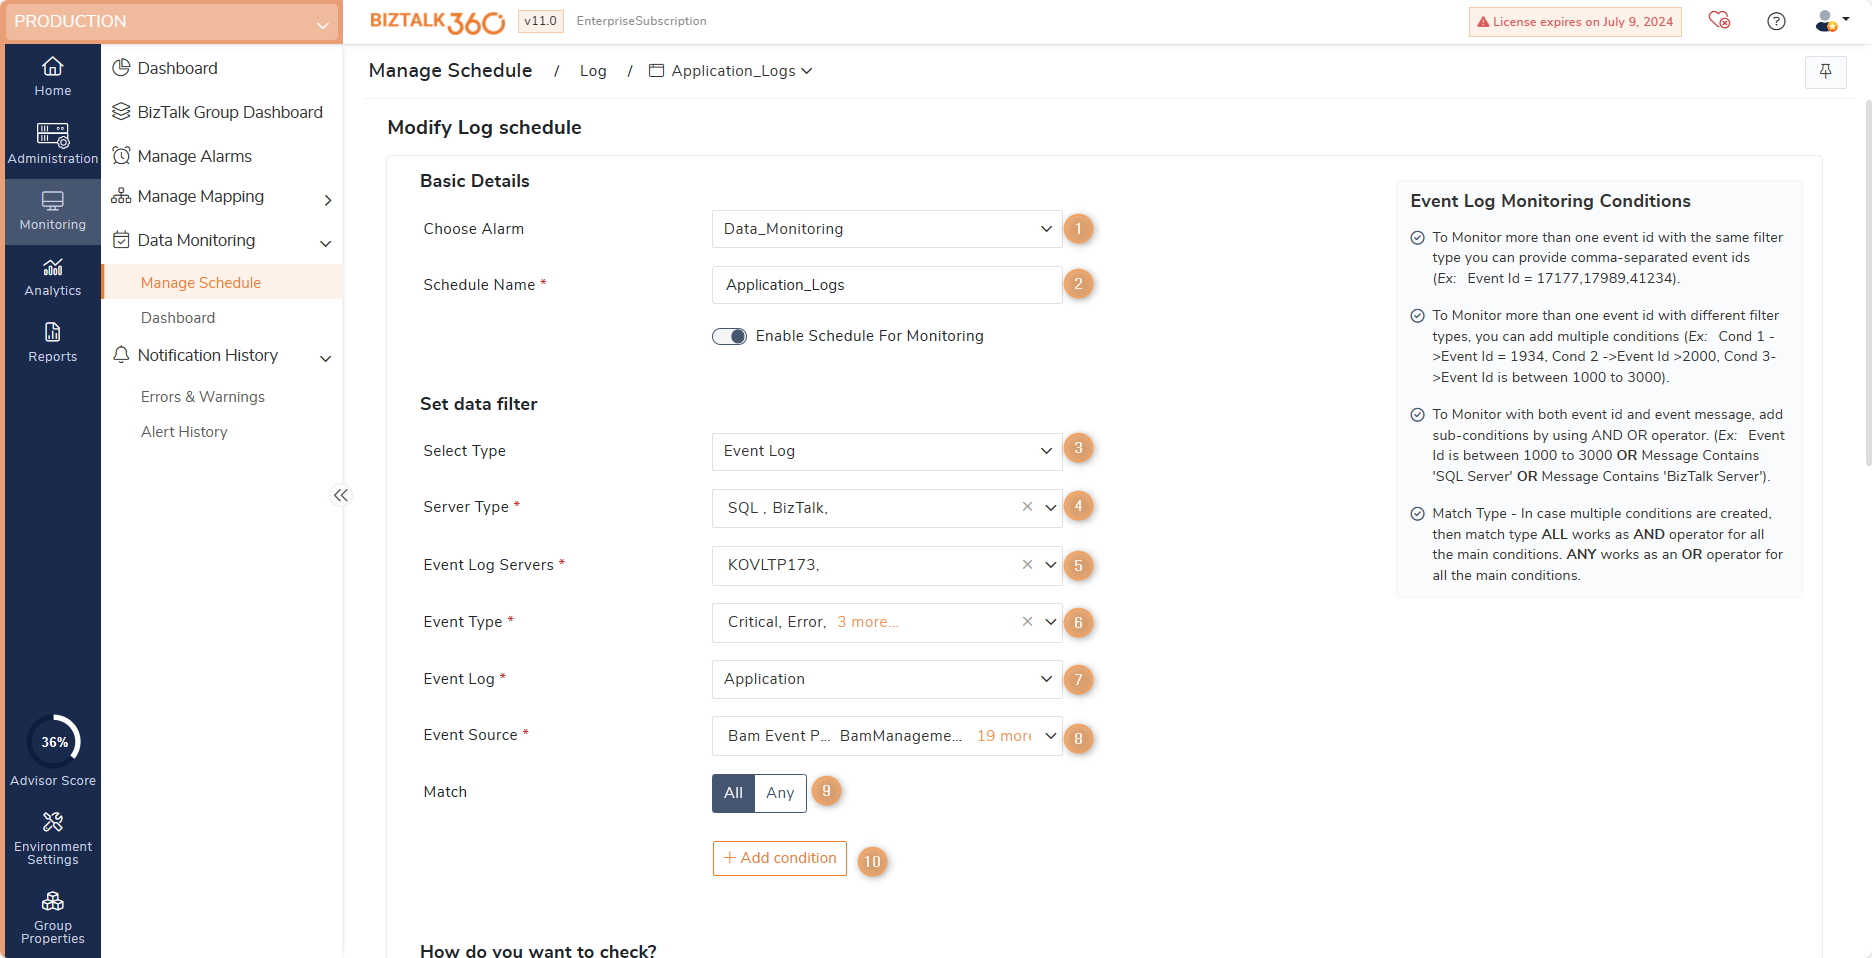
- Choose Alarm - As mentioned above, the first step to set up event log data monitoring is to create an alarm. Once you have created the alarm, the alarm name will be displayed in the drop-down. Select the alarm that should be used for event log data monitoring purposes.
- Schedule Name - A meaningful name for the event log data monitor. Say, as per your requirement you want to filter condition for Runs Succeeded for every 15 minutes when the count. The monitor's name can be set to "Runs Succeeded monitor". Enable the monitoring schedule. you can disable this to stop monitoring.
- Select type as Event Log.
- Server Type - Select the server type SQL, BizTalk.
- Event log servers - Select the actual servers that need to be monitored.
- Event Type - Select the Log level Error, Warning, Information.
- Event log - Event logs like Application, System, Security, etc can be configured in BizTalk360 Settings. The configured logs will be listed here for monitoring.
- Event Sources - Pick the event sources configured in the Advanced Event Viewer Settings
- Match Condition -This option needs to be selected for the filter options that are selected in the above fields. By default, the value of this field is "All". ALL works as And condition which checks for all the conditions to be true, ANY works as OR condition which checks for anyone condition to be true.
- Filters - In Addition, you can filter with Event Id and Message by adding multiple conditions. You can avail the multiselect options in the event log filters.
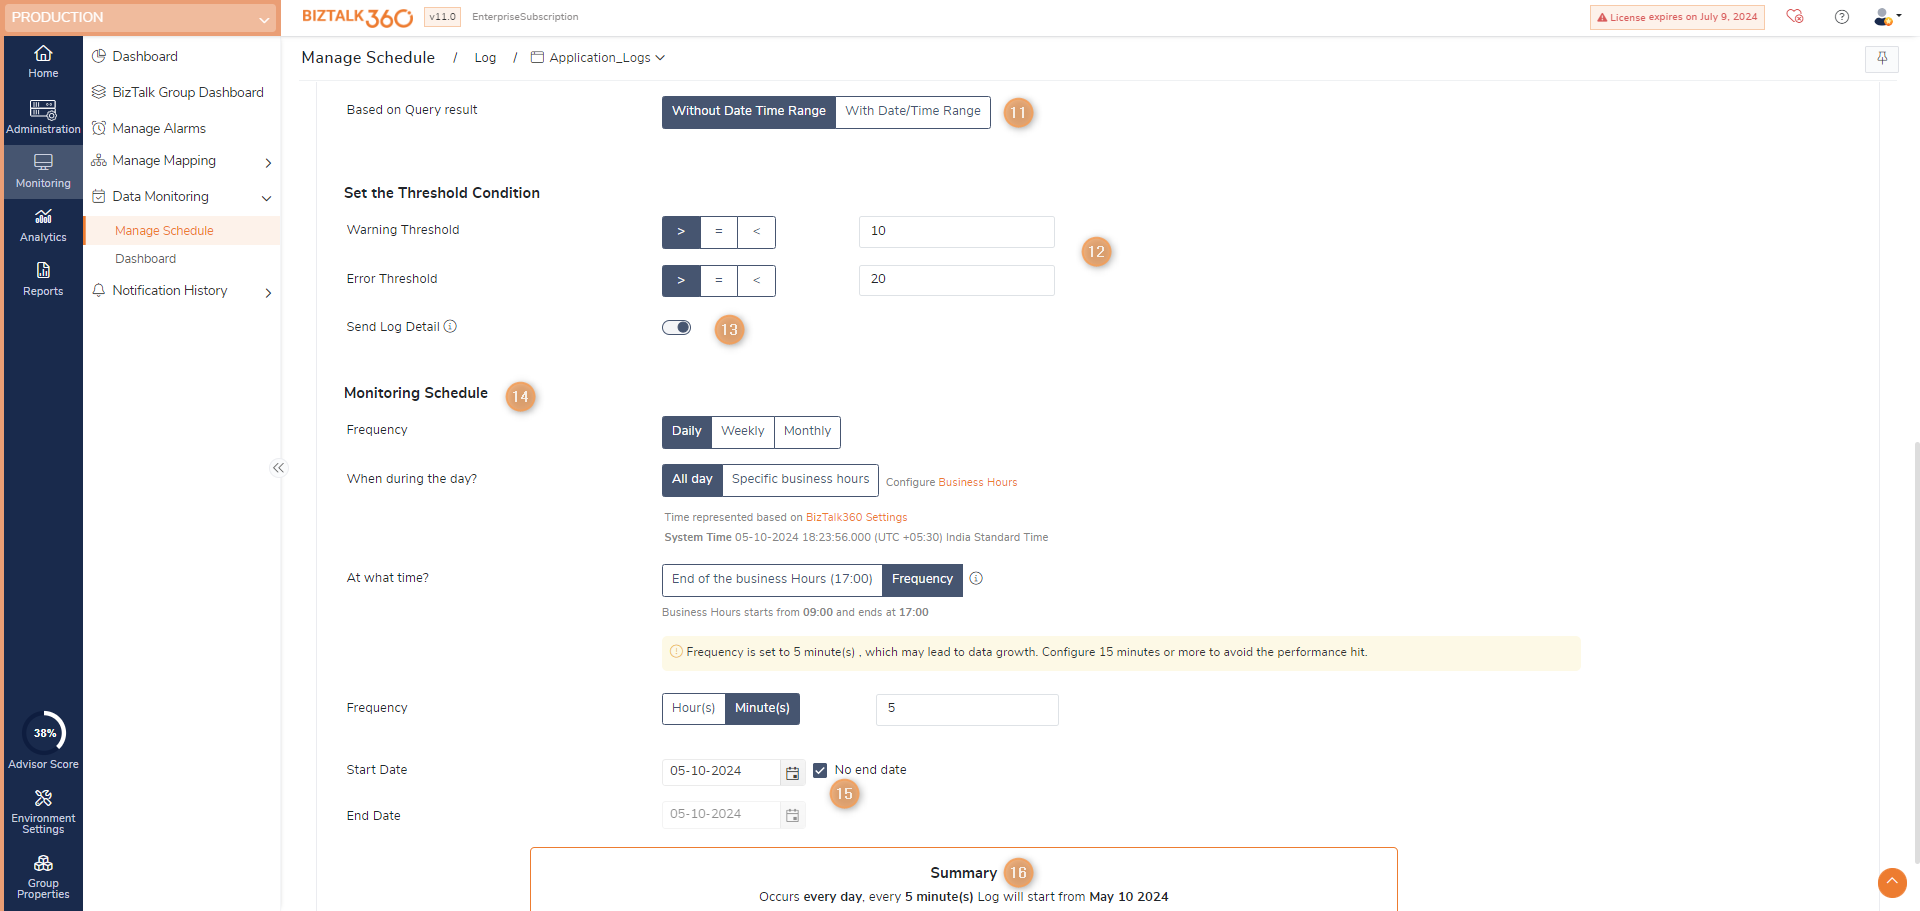
- How do you want to check - Choose whether you want to monitor all the logs from the beginning or only the past few days of logs based on the error logged time.
- Set the Threshold Condition - Configure error and warning threshold limit values.
- Send Event Log Details - Enable this option to receive log details in an email, including the login time. The log details are grouped by Event Log ID by default, but users can adjust the grouping option in System Settings -> Monitoring Notification -> Group By.
- Monitoring Schedule
- Frequency (How often you want to monitor) -Select Daily to monitor the daily activities of the environment and send the log details at the end of the day.
- When during the day - Select when the data monitor must execute on a particular day during business hours. You can customize your business hours by selecting the values from the Business Day Start and Business Day End options.
- At what time?
- End Of the Business Day - For e.g., if the business end time specified is 5 PM (default value), the data monitor will execute at 5 PM and send an alert at 5 PM. If monthly is chosen, it has an additional option called "End-of-Month." By selecting this option, the schedule will be executed at the end of the month, considering the complete month's data for monitoring purposes.
- Frequency - Select the number of minutes/hours after which the data monitor should execute. E.g., For 1 hour means the data monitor will run once every 1 hour.
- Frequency (How often you want to monitor) -Select Daily to monitor the daily activities of the environment and send the log details at the end of the day.
- Start Date / End Date - When you want to start/stop the scheduled execution. If you want the schedule to execute all the time, choose No end date.
- Summary - The summary information will automatically be listed based on the information selected in the previous steps. Click the Save button to store the schedule configuration.
Event Log Execution Results
Once the schedules are created, it will get executed on the specified time frame. Once after the execution of schedules, it will be displayed in the data monitoring dashboard. You can go to the data monitoring dashboard and click on the respective schedule to view the data monitoring schedule execution results.
Once the Event log Data Monitor is created and configured, it will execute during the specified time intervals. The Data Monitoring dashboard will display the status of the Event log Data monitor on a specific date at a specific time interval in the calendar chart control.
Based upon how you configured your Data Monitoring alarm, emails might get triggered to the email id(s) which are specified while creating that Data Monitoring alarm.
The email alert(s) will contain the Event log Data Monitor Execution Results of the data monitor. Alternatively, if you also selected the 'Notify on Success as well' option, you will receive the success alert emails as well to your mailbox. The following screenshot depicts a successful email notification received for a configured Event log Data monitor.
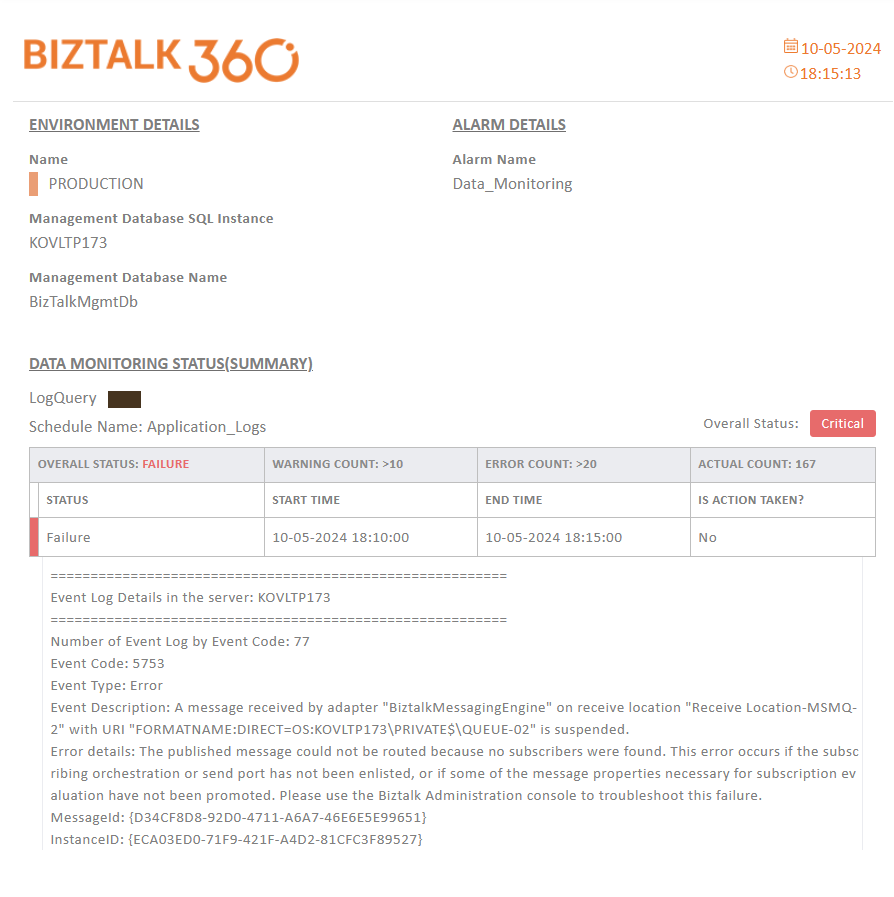
In the alert sent as a result of violation for an event log, A link to the KB article is included in the data monitoring alert mail if the resultant service instance is already documented in KB if it is associated with the respective event id, which helps in quickly resolving the problem.
To get the link BizTalk360 hosted URL must be added in the settings -> System Settings-> Data Access ->BizTalk360 Hosted URL.