What is the purpose of Message Box Data Monitoring?
When messages flow into the BizTalk Server, the messages get persisted in BizTalk Server's Message Box database. The service instances might move into different states such as Suspended (Resumable), Suspended (Non-Resumable), Active, Ready to Run, Dehydrated, and so on. Once the service instance moves into a particular state that demands user intervention, this forces the BizTalk server administrator to manually log in to the BizTalk Server Administration Console and fix the problem with respect to the service instance.
BizTalk360 solves this problem through the Message Box (Queries), offering administrators to query the message box database for such messages and take action without having to log in to BizTalk Server Administration Console. Despite offering this capability to BizTalk administrators, BizTalk360 goes one step further to reduce the manual intervention that is required from the administrators.
Through the Message Box Data Monitoring concept, administrators can choose what needs to be done when a service instance becomes suspended. For instance, the administrator can set up an alarm like "If there are more than 20 Suspended Service Instances between 09:00 AM and 05:00 PM, resume all the instances". He can simply log in to the BizTalk360 Data Monitoring Dashboard to see the status of the message box data for the day. He can also set up email notifications for the alarm. By doing so, the administrator eliminates the need to often log in to the BizTalk360 application and check for the status of the service instances.
Setting up a Message Box Data Monitor
Follow the steps as shown below to create a Message Box Data Monitoring alarm
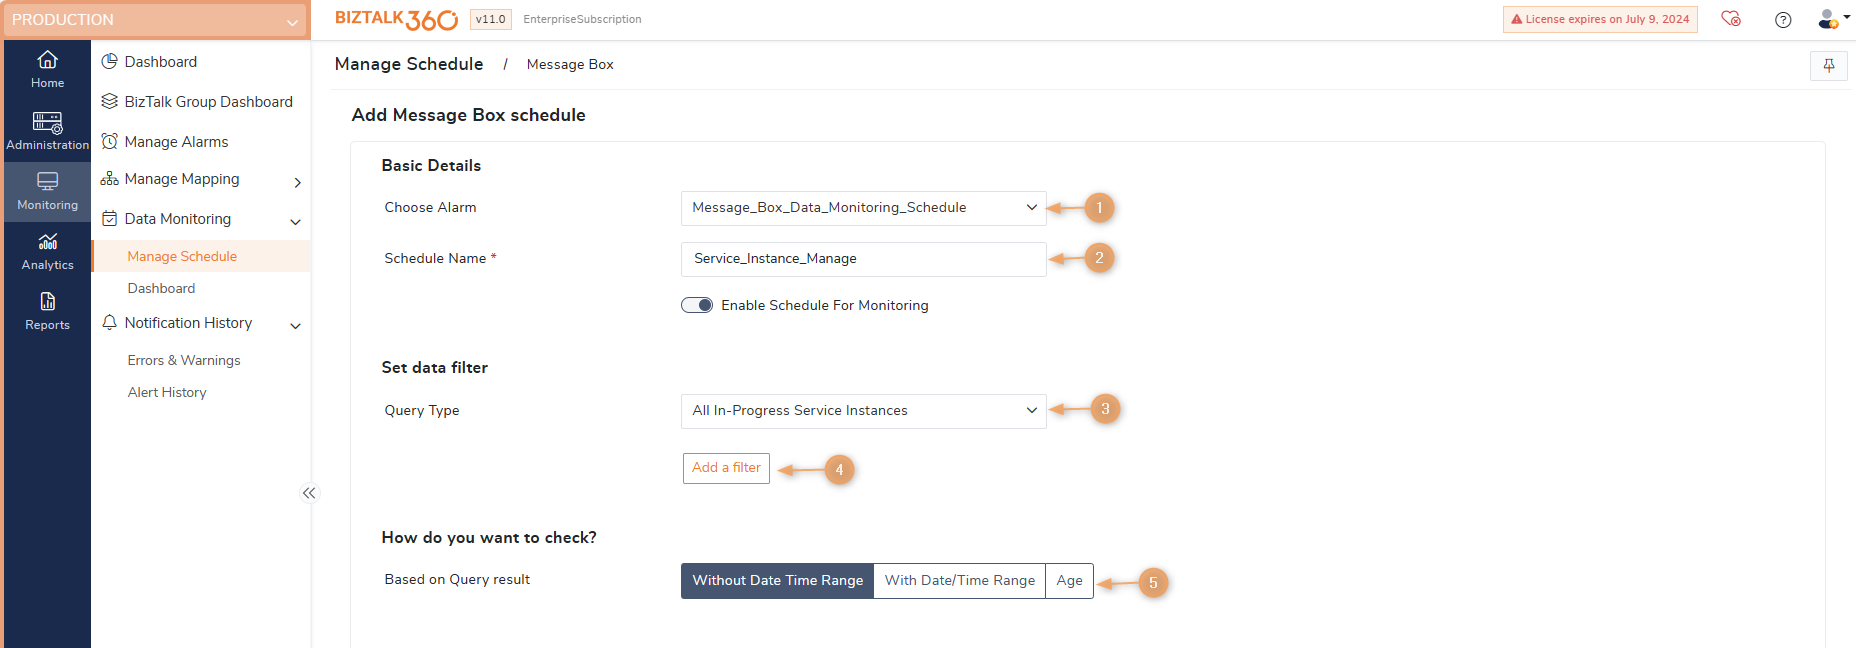

- Choose Alarm - As mentioned above, the first step to set up Message Box data monitoring is to create an alarm. Once you have created the alarm, the alarm name will be displayed in the dropdown. Select the alarm that should be used for message box data monitoring purposes.
- Schedule Name - A meaningful name for the Message Box Data Monitor. Say, as per your requirement you want to terminate the suspended instances after every 15 minutes when the count goes above 20. The monitor's name can be set as "Terminate suspended instances every 15 minutes when count > 20."
- Query Type - This section is very similar to the Message Box (Queries) section in BizTalk360. Select the type of query for which you want to run the data monitor. As per the above requirement, since we are looking for suspended instances, select 'Suspended Service Instances' from the drop-down
- Add a filter - To filter the query results based on different parameters (application name, hostname, instance status, service class, service instance id, service name, service type id)
- Based on only Query result count (no date/time filter)- Selecting this option will execute the message box query without applying any date time filter.
- Based on Query result with date/time range - Selecting this option will apply the Creation Time filter for the given query filter execution. (The values configured for setting trigger time, Set Monitoring Times ->At What Time, will be used for Creation Time filter). For e.g.: When Monitoring set frequency is set for 1 hour, then for every query execution the query will consider only 1-hour data "[DateCreated] > DATEADD (HOUR, -1, GETDATE ())".
- Based on Query result (Age)-In V10.1 age monitoring is introduced, which allows you to check the instances which are older than a specific time duration. You can provide the Age value in minutes/hours/days, only the instance created during that time will be considered for Query execution.
- Is Action Required - Selecting this checkbox enables you to automate tasks such as regularly terminate instances, resume instances, and so on. You can define an action such as "Whenever there are Suspended (Non-Resumable) service instances during the monitoring time range, the system should automatically terminate them. Similarly, whenever there are Suspended (Resumable) instances, the system can automatically Resume these messages. The following options are available for the Is Action Required setting:
- When to Action - Defines when you need to take an action - Always (or) when there is an error condition (or) a warning condition. You need to be cautious about enabling it since some of the actions performed by the system cannot be undone.
- What Action - Defines what action needs to be taken - Resume, Suspend or Terminate. You need to be cautious about enabling it since some of the actions performed by the system cannot be undone, when you select the action as "Terminate", you will notice the toggle option for "Archive message(s) content & context associated before Terminate". Enabling the toggle will automatically archive the service instance details to a folder before terminating.
Turn Of Action Notification - While creating an alarm for MBQ Data Monitoring, users can enable this option to stop receiving notifications for actions taken. To know more about this option look into this article. - The monthly Data Monitoring schedule configuration now includes an additional option called "End-of-Month." By selecting this option, the schedule will be executed at the end of the month, considering the complete month's data for monitoring purposes.
- Number of Retries - Click the numeric value to set the number of retries the process monitoring service should attempt.
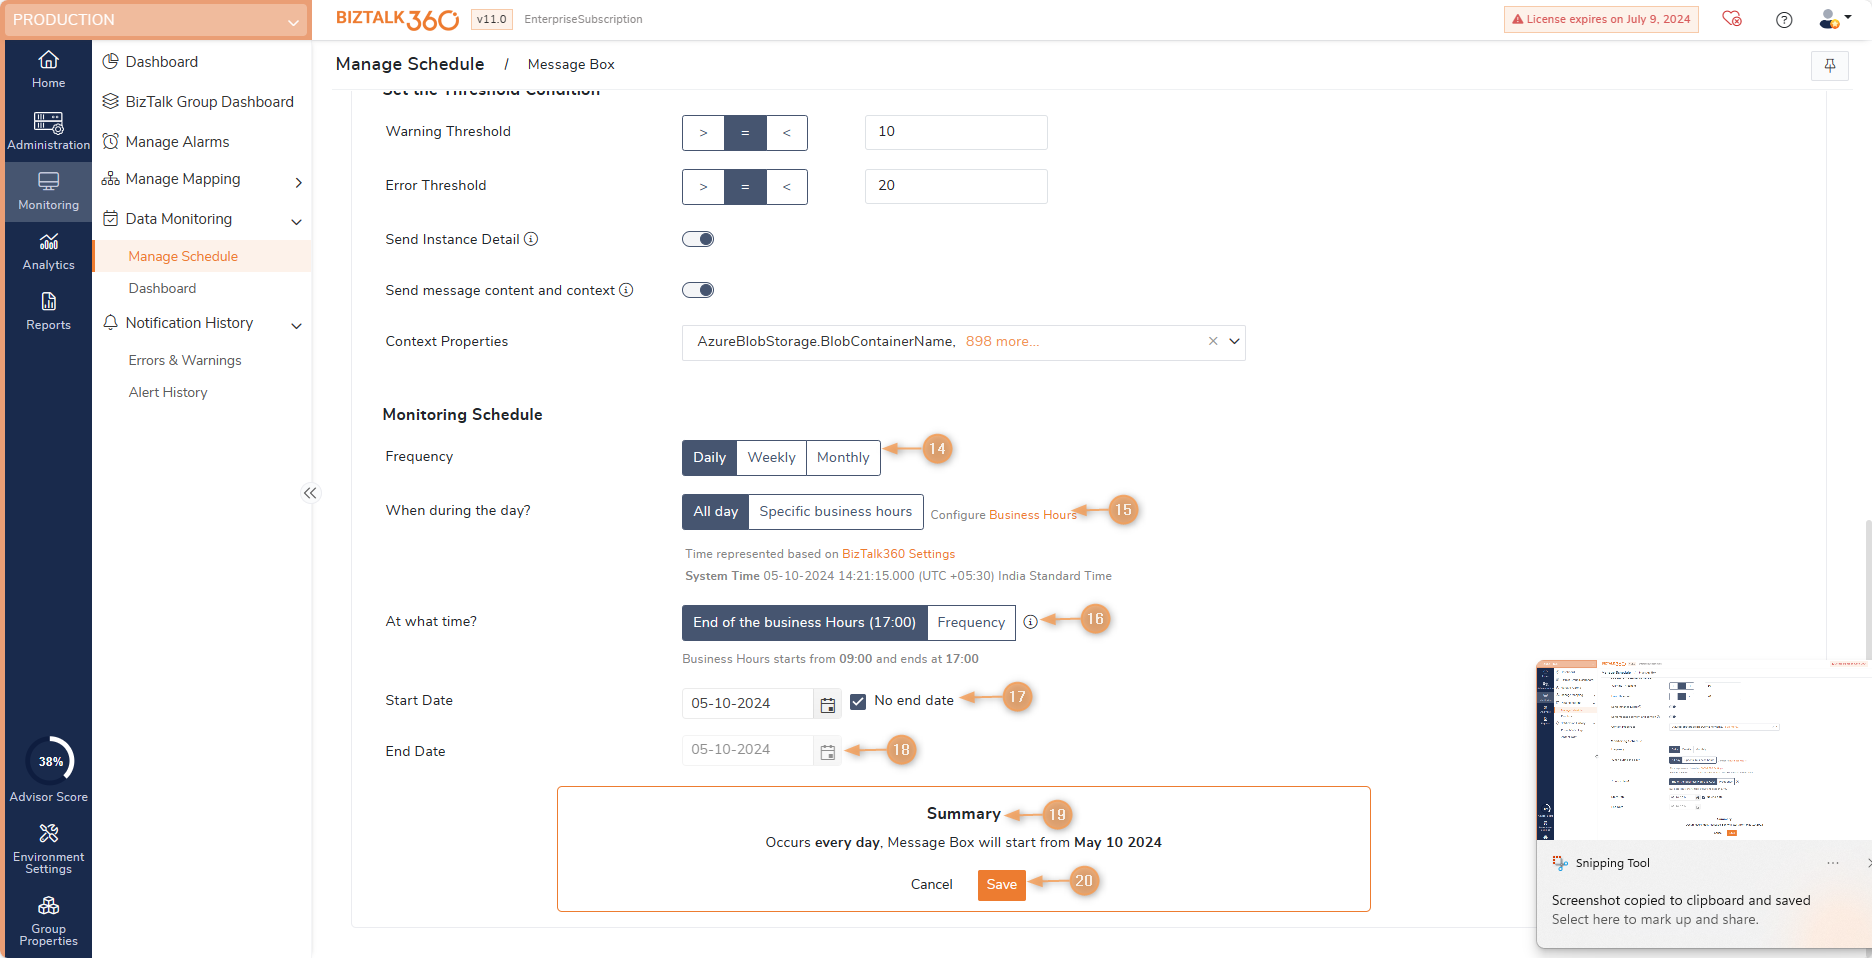
- Warning Threshold - Select the value from the drop-down on when you want to be notified when there is a warning. The first drop-down is to select the Operator (> or =) and the second operator is to select the warning value. For e.g., When the number of service instances is> 10, throw a warning.
- Error Threshold - Select the value from the drop-down on when you want to be notified when there is an error. The first drop-down is to select the Operator (> or =) and the second operator is to select the warning value. For e.g., When the number of service instances is> 20, throw an error.
- Send Instance Detail in Notification - Selecting this checkbox will send the instance details and exception description in the notification email when the number of instances exceeds the warning and/or error threshold level.
- Send message content and context in the notification email - Selecting this checkbox will send the detailed message content and message context in the notification email when the number of instances exceeds the warning and/or error threshold level.
- Scheduling Options
Under the “How you want to monitor” section, you can choose how frequently to monitor suspended service instances. The available options are Daily, Weekly, Monthly, and Custom. Based on your selection, you can further refine the monitoring criteria.- Daily - will set up the data monitor to execute everyday.
- Weekly - The data monitor will execute on the selected days of the week (Every Day, Monday-Friday, or the selected day of choice). To add a single day of the week, click the control and select the day of your choice.
- Monthly - The data monitor will execute on the selected day of the month. To add a specific day of the month, enter the date in the space provided or select the date from the drop-down
If a particular day is not present in the month (say, 29th Feb), then the system will skip that month and generate the results on the specified day in the next month. The monthly Data Monitoring schedule configuration now includes an additional option called "End-of-Month." By selecting this option, the schedule will be executed at the end of the month, considering the complete month's data for monitoring purposes. - Custom - The Custom option allows you to define flexible execution ranges, such as running monitoring every 48 hours, every few days or on specific weeks of a month.
All Months: Define a recurring custom interval in hours, days, or weeks—for example, every 2 hours, every 2 days, or every 2 weeks.
Specific Months: Select a particular month and configure the occurrence, such as the first and fourth weeks of January, or patterns like the last Friday of every month or a specific week.
- When during the day- Select the time when the data monitor must execute on a particular day during business hours. You can customize your business hours by selecting the values from the Business Day Start and Business Day End options. By default, the business day start time is 9 AM and the business day end time is 5 PM. Depending on the business hour selection, the following options are available when you want the data monitor to execute on a particular day.
- At the end of the business day - If this option is chosen, the data monitor will execute depending on the value chosen in the Business Day End field. For e.g, if the business end time specified is 5 PM (default value), the data monitor will execute exactly at 5 PM
Monitor every X minutes/hours - You can define specific intervals during the business hours when the data monitor should execute. The options available are Minutes and Hour.- Minutes - Select the number of minutes after which the data monitor should execute. E.g., 30 minutes means the data monitor will execute once every 30 minutes. The minimum time interval supported is 15 minutes, which means the data monitor will execute 4 times (15 minutes x 4 = 60 minutes) in an hour.
- Hours - Select the number of hours after which the data monitor should execute during the business hours. E.g., 2 hours means the data monitor will execute once in 2 hours between 9 AM and 5 PM. The minimum time interval supported is 1 hour.
- At the end of the business day - If this option is chosen, the data monitor will execute depending on the value chosen in the Business Day End field. For e.g, if the business end time specified is 5 PM (default value), the data monitor will execute exactly at 5 PM
- Start Date - This section can be used to define advanced settings for data monitoring. You can define a date range (from the date and to date) when you want the data monitor to execute. You can set up a data monitor to start, say, on a Monday and end on the next Tuesday. In addition to this, you can set up the other settings mentioned above in the previous steps. This means the data monitor will only start to run next Monday and will not execute after Tuesday. By default, the Advanced section will be in a Collapsed state. Click the '>' button to expand the Advanced section and make the settings.
- End Date - Configuring the date in this is to end the schedule from that day.
- Summary - The summary information will automatically be populated based on the information selected in the previous columns.
- Save - Once all the values are selected in the previous steps, click Save to save the settings.
Automated Actions on Service Instances
You may face a situation there may not be any action on suspended instances when you configured automated action in Message Box Data Monitoring. BizTalk360 Data Monitoring schedule results show that the task action is successful, but no action has been taken.
Let's Assume a scenario, where you want all the suspended instances in your message box need to be resumed. You can achieve this by creating a message box schedule by selecting the query type as "Suspended Instances". Then, enable the "Is action required" toggle and choose resume option. You can opt to resume the instances on three conditions, "Every time, On error Condition, On warning condition". You can choose this based on your requirement. Save the schedule configuration after providing the time to be executed.
Number of Retries
BizTalk360 will take action against the suspended instances, irrespective of the "Number of Retries" count set in the schedule. If the Instance is suspended in the port, then BizTalk360 will check how many times the instance is retried by BizTalk Server.
If the number of retries done by BizTalk is less than or equal to the count set in BizTalk360 then it will resume the instance until it exceeds the count set. If the number of retries done by BizTalk is greater than the count set in BizTalk360 then it will stop resuming the instance on further monitoring schedule. Check the retry count between the BizTalk artifact and the BizTalk360 count in the UI. If the BizTalk360 Configured Value is 3 and the BizTalk server's Current Retry Count is 4 so the BizTalk360 didn't take any action.
Archiving Service Instances Before Termination
When choosing the "Terminate" action for a suspended service instance, an option labeled "Archive message content & context associated before terminate" will appear. Enabling this checkbox ensures that the message content and context are automatically archived to a designated folder before the service instance is terminated.
The archive location can be configured by navigating to,Settings → System Settings → Monitoring and Notification → Monitoring Settings → Archive Location. Once configured, any service instance terminated , will have its data stored in the specified location.
Restrict Access by Group
Since each schedule archives instances to its own folder. This enables you to restrict access by assigning folder-level permissions based on user groups.
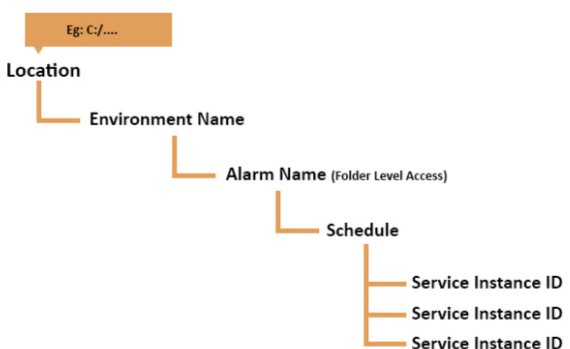
For example, in an organization with multiple departments such as Inventory, Sales, and Logistics, you can create dedicated alarms and monitoring schedules per department. For the Inventory department, set up an Inventory Alarm and Inventory Schedule. The archive path will be structured as D:\BizTalkArchives\Inventory\InventorySchedules\e5ca4571-4092-4947-a7cc-e4804fd5755f\{8D11D95D-A3E0-4C25-92C1-F2190CA7BCA0}_{06193901-10E2-4056-8791-96E731893BCA}_part.out
Folder access can then be granted exclusively to the Inventory Support Team, ensuring that only authorized users from that team can view the archived service instances, thereby maintaining secure, department-specific access control.

Ensure that the full archive path, including all subfolders and filenames, does not exceed 248 characters. This limitation is due to standard Windows and .NET path length constraints.
Exceeding this limit may result in exceptions such as DirectoryNotFoundException or PathTooLongException during the archiving process.
Data Monitoring Execution Results
Once the schedules are created, it will get executed on the specified time frame. Once after the execution of schedules, it will be displayed in the data monitoring dashboard. You can go to the data monitoring dashboard and click on the respective schedule to view the data monitoring schedule execution results.
.gif)
Once the Message Box Data Monitor is created and configured, it will execute during the specified time intervals. The Data Monitoring dashboard will display the status of the MessageBox data monitor on a specific date at a specific time interval in the calendar chart control.
Based upon how you configured your Data Monitoring alarm, emails might get triggered to the email id(s) which are specified while creating that Data Monitoring alarm.
The email alert(s) will contain the Message Box Data Monitor Execution Results of the data monitor. By default, if you only selected the 'Use this alarm for Process Monitor Alerts' option, you will only receive the Failure emails to the configured email address(es). Alternatively, if you also selected the 'Notify on Success as well' option, you will receive the success alert emails as well to your mailbox.
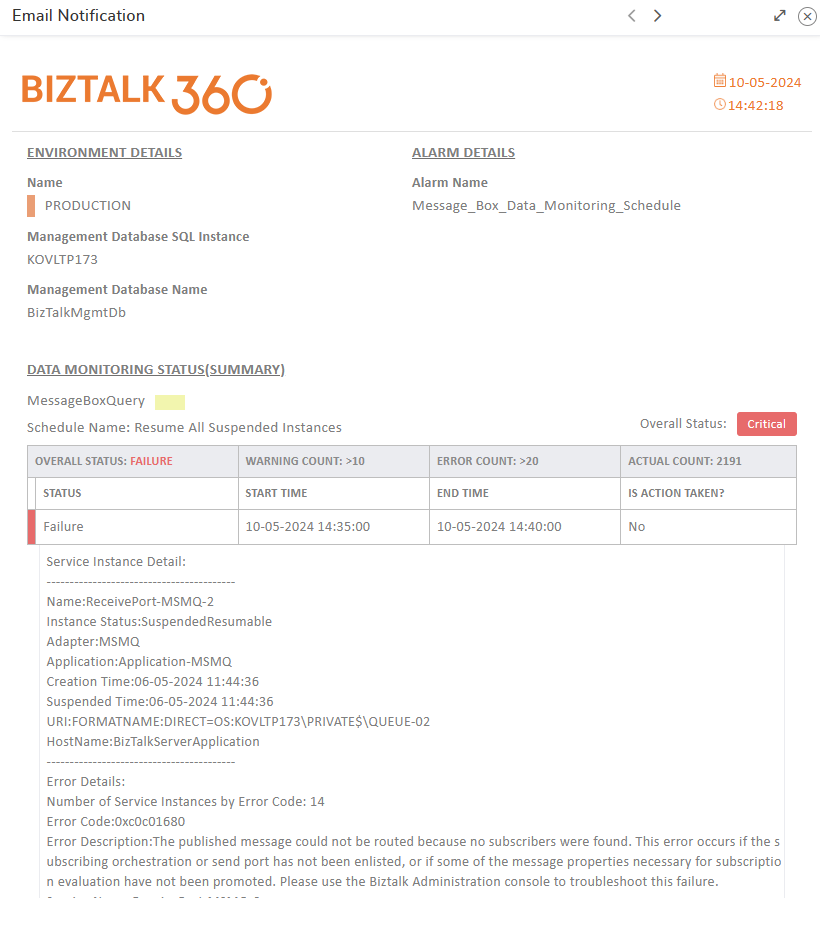
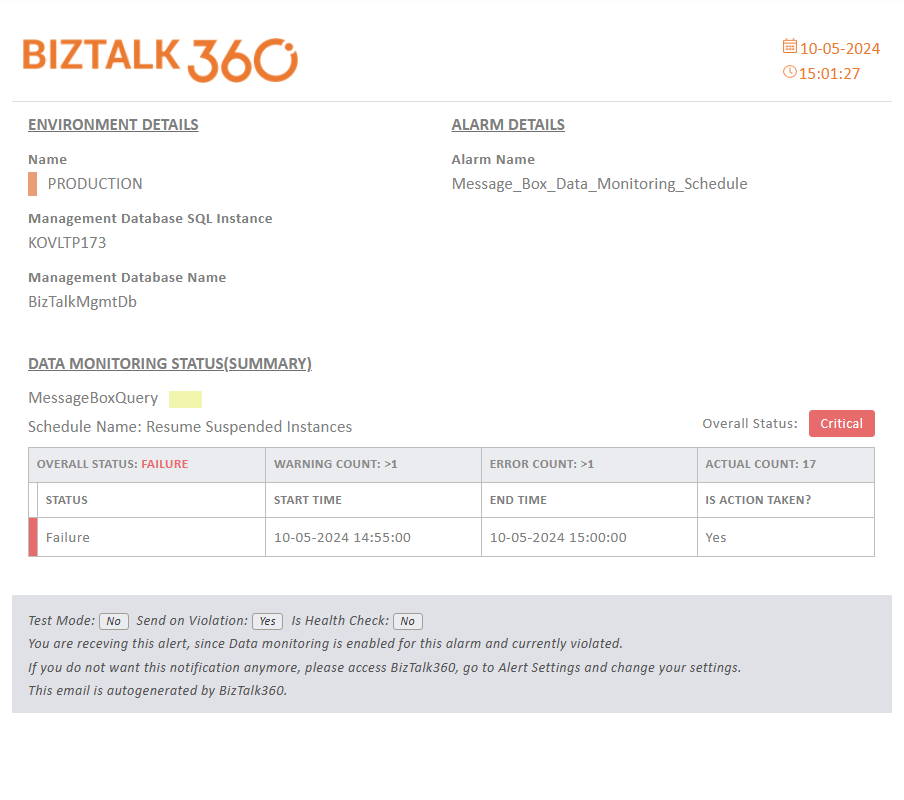
The email notification provides the detailed status of the data monitor - the status of execution, the warning & error count as defined in the data monitor, and the actual count of service instances that were in the particular state when the data monitor executed. The email notification also provides the detail of whether any specific action was taken by the data monitor (suspend/terminate/resume) as defined in the data monitor. Below is the alert sent when actions are taken for the instances.
A link to the KB article is included in the data monitoring alert mail if the resultant service instance is already documented in KB, which helps in quickly resolving the problem. To get the link BizTalk360 hosted URL must be added in the settings->System Settings-> Data Access ->BizTalk360 Hosted URL.