Monitoring dashboard
- 26 Apr 2024
- 4 Minutes to read
- Print
- DarkLight
- PDF
Monitoring dashboard
- Updated on 26 Apr 2024
- 4 Minutes to read
- Print
- DarkLight
- PDF
Article summary
Did you find this summary helpful?
Thank you for your feedback
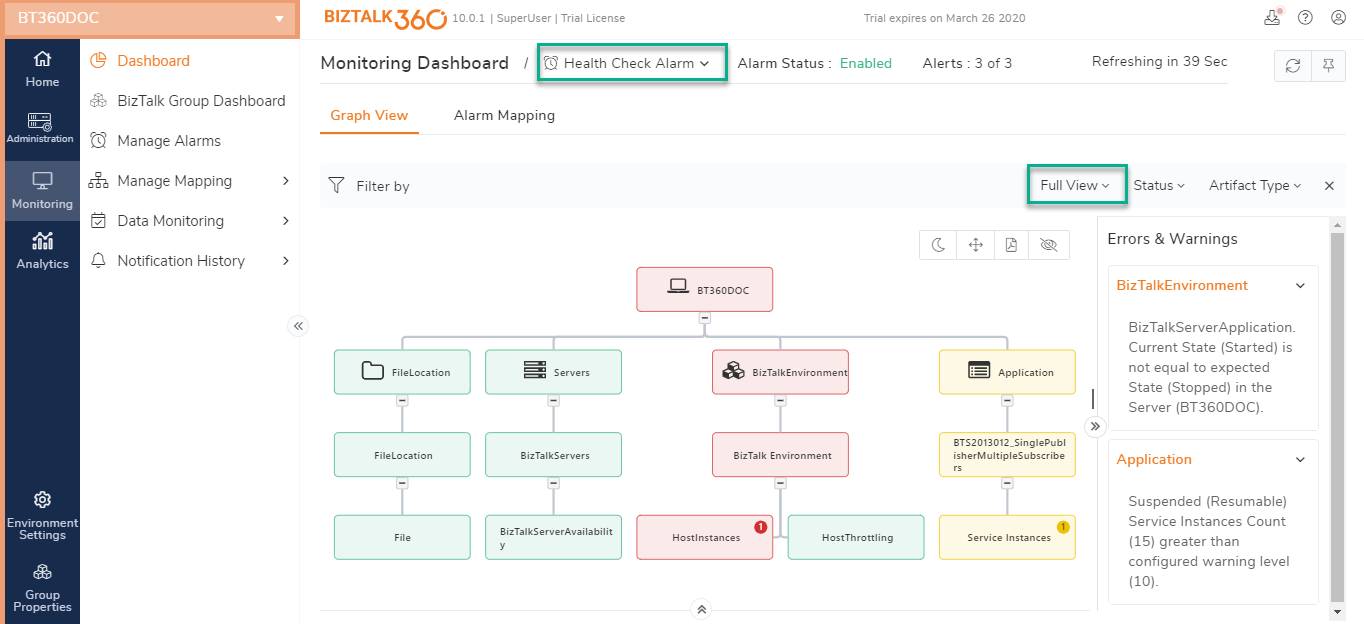
Once alarms are created and functioning, then the 'Monitoring Dashboard' becomes the one-stop point for support people to view the status of the alarm(s). Users can choose the relevant alarm from the drop-down box, which will display the Monitoring Dashboard. Customers typically display the monitoring dashboard on big LCD screens which helps them to keep an eye on the health of their environment in a visual way.
The Monitoring Dashboard can be reached as follows:
- Log in to BizTalk360and navigate to Monitoring from the selected environment.
- Select the Alarm from the drop-down for which you want to see the overall Monitoring status.
Graphical Tree View Structure
The Monitoring Dashboard provides a single page graphical tree view structure of the status of all configured sections within an alarm. The dashboard has several characteristics. See below for a list of the most important ones:
- When you click a node in the graph, you will be navigated to the corresponding section
- The Fit to read option can be used to fit the entire contents of the tree view into your screen , which is easy to read each node
- Dark/Light mode - you can set the background of the dashboard as black or white by setting the display mode as either dark or light, default it's set as light mode. Once the display mode is selected, it will persist until you change your preference for the next time
- The dashboard is scalable, as you can create complex monitoring configurations for the different applications in your environment
- The tree view expands on the horizontal and vertical axis and is interactive so that you can zoom in and zoom out to view the status of the artifacts
- The nodes in the monitoring dashboard are color-coded as Green, Yellow, and Red, representing healthy, warning, and error states. If any of the nodes in the overall structure goes Red, the complete path from that node to the root node will be highlighted in Red representing there is a problem in the environment
- The Download PDF option can be used to download the entire content of the graph
Filters
The Dashboard allows you to apply filters to event types (Errors and Warnings) and top-level monitoring sections (BizTalk Application, BizTalk Server, SQL Server, SQL Instance, and BizTalk Environment) for which you want to see the dashboard. You can choose an array of combinations as per your requirement by selecting the values in the checkboxes and the dropdown.
.png)
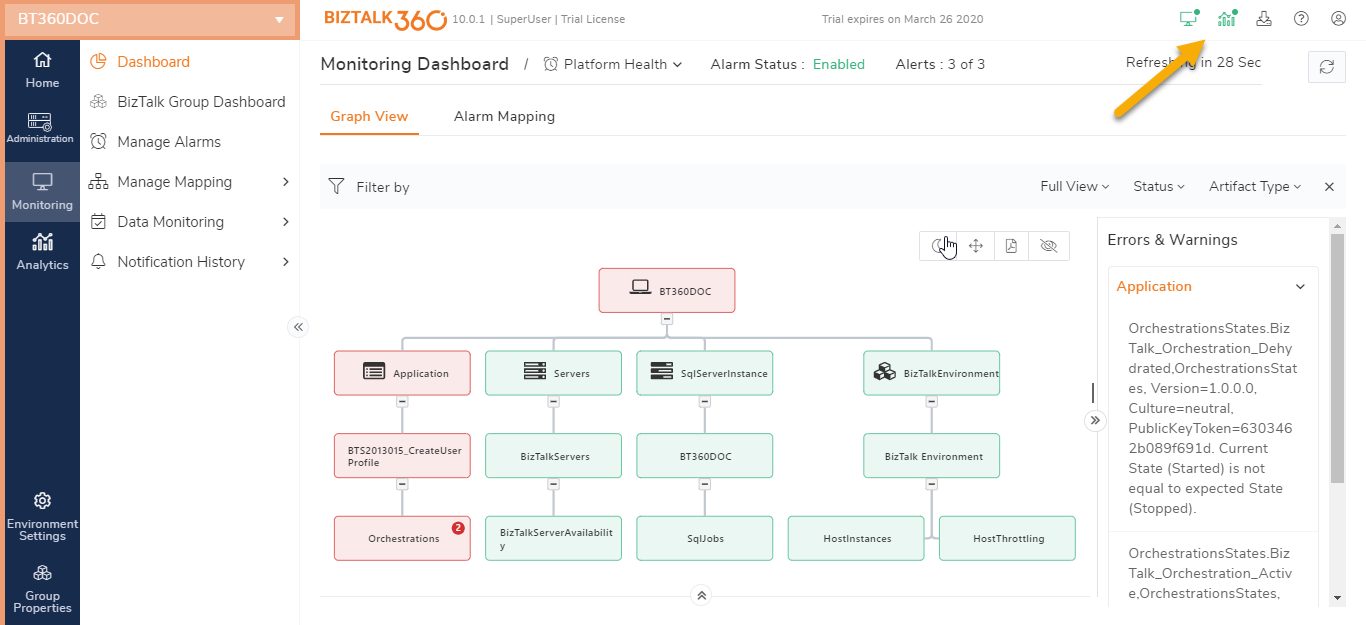
Service Status
The status of the Monitoring and Analytics services can be seen In the upper right corner of the dashboard page. The status information will contain the last execution time of the BizTalk360 monitoring service. If the service is running, you will see a Green color status icon. If the monitoring service is stopped/paused, you will see a Red color status icon with the last time when the monitoring service fetched the information. The last execution time of the monitoring service is also listed below to the status.
 Alarm Details
 Alarm Details
Select an alarm from the drop-down, after which the dashboard will show the monitoring graph for the artifacts that are associated with the selected alarm.
Alarm Status -Indicates whether the selected alarm is Enabled/Disabled. You will see the updated graph with the current status of the artifacts only when the alarm is enabled.
Alerts - Indicates the number of notification alerts sent among the configured alert count. The count is applicable only if the selected alarm is Threshold type.
.png)
Auto-refresh
The Monitoring Dashboard automatically refreshes every 60 seconds and the graph gets updated with the latest information. You can also refresh the dashboard manually, by clicking the Refresh button in the upper right corner.
Full-Screen Mode
The Graphical tree view can be expanded to fill the entire screen with the Full-Screen feature. This feature is great for those users using screens on netbooks or to make the most of HDTV screens. The Full-screen mode lets you expand the tree view to fill up your whole screen. You can toggle back to the normal view by pressing the Escape button.
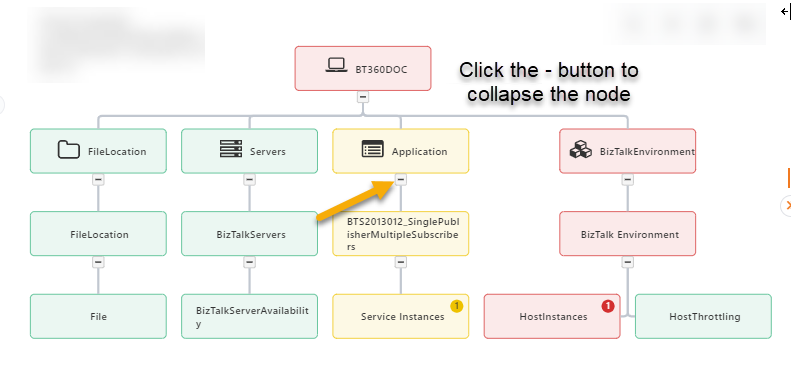
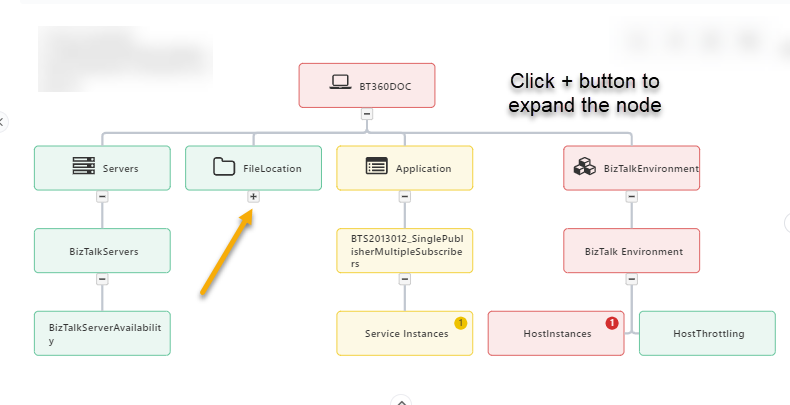
Expandable/Collapsible nodes
The monitoring dashboard in full view and collapsed view mode shows a graphical tree view structure with the status of each configured sections within the alarm. A complex BizTalk environment will have numerous BizTalk resources created and monitored. These resources might be related to each other, might be independent, but they all work in a shared BizTalk environment. Viewing such complex environments in a graphical tree view will often be cluttered and difficult to visualize in one view. To reduce the amount of clutter, you have the option to expand and collapse at the node level. Using this option you can expand the nodes that you wish to view and collapse the insignificant nodes.
Error Information
You can view error information in two ways:
- by clicking the error node to view the error associated with the particular node
- by clicking the Error Info button to view the complete list of errors associated with the alarm
Collapsed view
The Collapsed view is split into 2 panes, being the graph and a grid. The application artifacts details are listed in the grid pane, you can easily redirect to the respective artifact just by clicking the node. The details of other artifact types such as Folder, Server, Queue Monitoring, etc. will be shown in the graphical pane.
.png)
Alarm Mapping
All the artifacts that have been mapped for monitoring under the selected alarm are listed in the Alarm Mapping section.
- Expand each monitor group type (Application, Queues, File Location, Server, etc ) to see the mapped artifacts
- Click the Delete option to remove all the artifacts under the respective monitor group, which have been mapped for monitoring
- Click on the Export option to download all the artifacts mapping configurations in Excel format.
Was this article helpful?