Tracking
- 13 May 2024
- 8 Minutes to read
- Print
- DarkLight
- PDF
Tracking
- Updated on 13 May 2024
- 8 Minutes to read
- Print
- DarkLight
- PDF
Article summary
Did you find this summary helpful?
Thank you for your feedback
What is the purpose of Tracking Data Monitoring?
Similar to the message box data monitoring concept, BizTalk360 allows administrators to automatically execute queries against the tracking database at a specific interval to view, analyze, and troubleshoot the tracked data. For e.g., the administrator can set up a monitoring alarm like "Check the tracking database every 30 minutes on all days in a week and warn me when there are more than 100 service instances in the started state and throw an error when the number of service instances in the started state exceeds 200 during the specific time period".
By setting up this alarm, whenever the number of service instances in the started state exceeds 100 during a specific 30-minute time interval period, the administrator will receive a warning email notification (with the status as "Warning") from BizTalk360 explaining the current situation. If the value is less than 100, the administrator will receive email notifications with the status as "Success". By setting up these alarms & notification mechanisms, the need to often log in to the BizTalk360 application and check for the status of the tracked service instances becomes eliminated.
Setting up a Tracking Data Monitor
Follow the steps as shown below to create a Tracking Data Monitoring alarm:
- In case you did not do it earlier, follow the steps as mentioned in this section to create a Data Monitoring alarm.
- Select the 'Use this alarm for Data Monitor Alerts' check box to map the current alarm to Data Monitors. Only when this option is selected, the 'Notify on Success as well' check box gets activated.
- The 'Notify on Success as well' check box is optional for Data Monitoring, while the Use this alarm for Data Monitor Alerts option is mandatory.
- Click OK to save the alarm information.
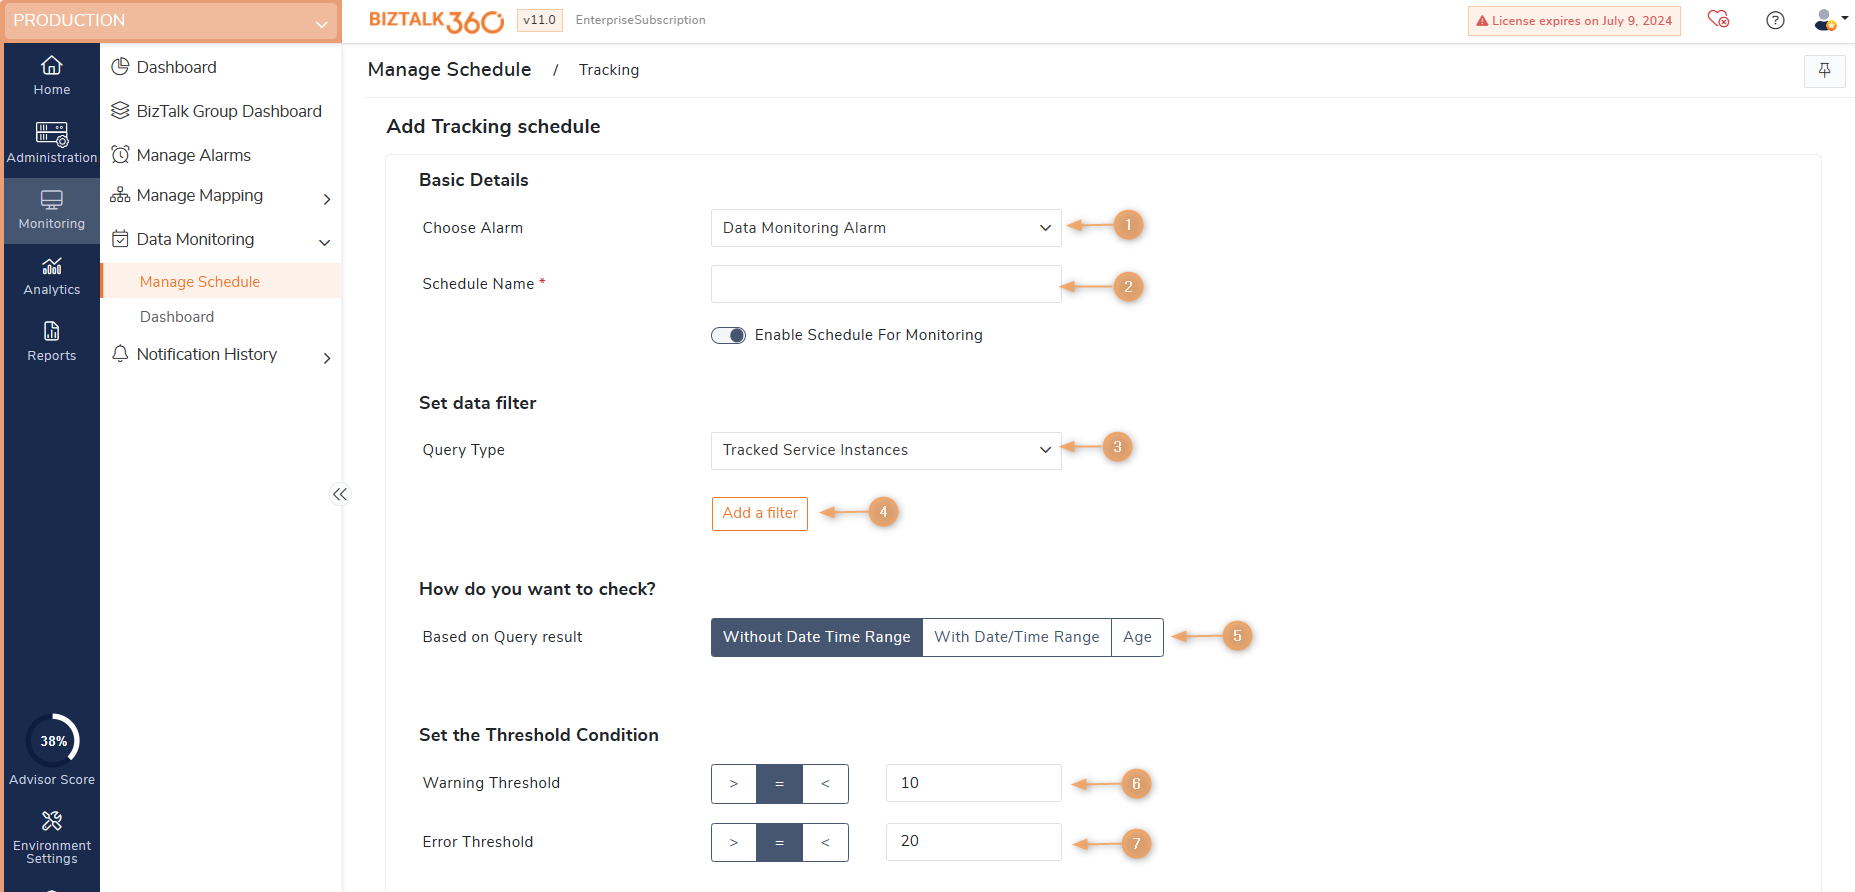


- Choose Alarm - As mentioned above, the first step to set up tracking data monitoring is to create an alarm. Once you have created the alarm, the alarm name will be displayed in the drop-down. Select the alarm that should be used for tracking data monitoring purposes
- Schedule Name - A meaningful name for the Tracking Data Monitor. Say, as per your requirement you want to get notified with a warning message when the number of tracked service instances in the started state is more than 200 and receive an error message when the number of instances in the started state is more than 500. The monitor's name can be set as "Tracked Service Instances in started state > 200, trigger warning; > 500, trigger error."
- Query Type - This section is very similar to the Graphical Flow (Tracking) section in BizTalk360. Select the type of query for which you want to run the data monitor. As per the above requirement, since we are looking for tracked service instances, select 'Tracked Service Instances' from the drop-down
- Add a filter - To filter the query results based on different parameters (assembly name, assembly version, error code, error description, hostname, service class, service instance ID, service name, state)
- How do you want to check
- Based on only Query result count (no date/time filter) - Selecting this option will execute the query without applying any date time filter. i.e All the data will consider for Tracking query execution.
- Based on Query result with date/time range - Selecting this option will apply the Start/End Time filter for Tracking query execution. (The values configured for setting trigger time, Set Monitoring Times ->At What Time, will be used for Start/End Time filter). For e.g.: When Monitoring set frequency is set for 1 hour, then for every Tracking query execution the query will consider only 1-hour data "[DateCreated] > DATEADD (HOUR, -1, GETDATE ())".
- Based on Query result (Age)-In V10.1 age monitoring is introduced, which allows you to check the instances which are older than a specific time duration. You can provide the Age value in minutes/hours/days, only the instance created during that time will be considered for Tracking Query execution.
- Warning Threshold - Select the value from the drop-down on when you want to be notified when there is a warning. The first switch is to toggle the Operator (> or =) and the second operator is to select the warning value. For e.g., When the number of tracked service instances are > 200, throw a warning
- Error Threshold - Select the value from the drop-down on when you want to be notified when there is an error. The first switch is to toggle the Operator (> or =) and the second operator is to select the warning value. For e.g., When the number of tracked service instances are > 500, throw an error.
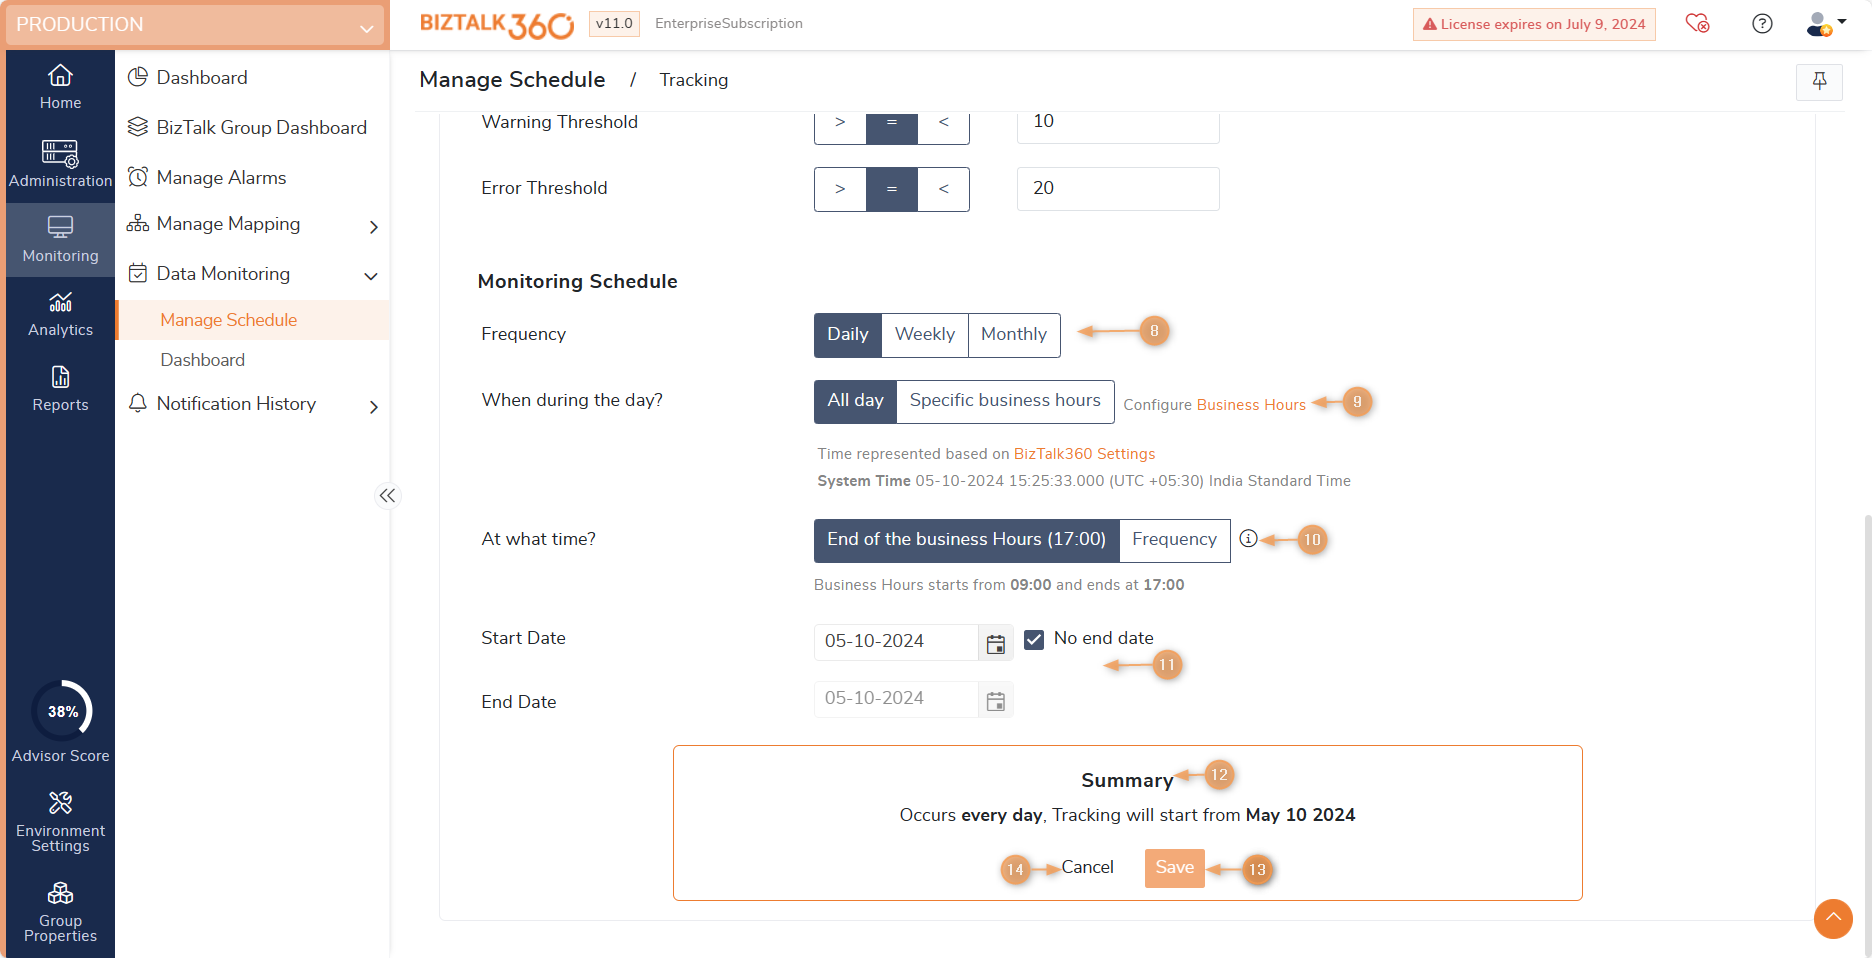
- Frequency- Select the duration of how often you want to monitor for tracked service instances. The options are - Daily, Weekly, and Monthly. Depending on the selection, you can add further filter criteria on how often you want to monitor.
- Daily - will set up the data monitor to execute everyday
- Weekly - The data monitor will execute on the selected days of the week (Every Day, Monday-Friday, or the selected day of choice). To add a single day of the week, click the control and select the day of your choice
- Monthly - The data monitor will execute on the selected day of the month. To add a specific day of the month, enter the date in the space provided or select the date from the drop-down. If a particular day is not present in the month (say, 29th Feb), then the system will skip that month and generate the results on the specified day in the next month. The monthly Data Monitoring schedule configuration now includes an additional option called "End-of-Month." By selecting this option, the schedule will be executed at the end of the month, considering the complete month's data for monitoring purposes.
- When during the day - Select the time when the data monitor must execute on a particular day during business hours. You can customize your business hours by selecting the values from the Business Day Start/End options. By default, the business day start time is 9 AM and the business day end time is 5 PM. Depending on the business hour selection, the following options are available when you want the data monitor to execute on a particular day.
- At what time- Select the time when the data monitor should execute on a particular day. The options are - At the end of the business day and at a set frequency (every 1 hour or 15 minutes).
- By default, the Advanced section will be in a Collapsed state. Click the '>' button to expand the Advanced section and make the settings.
- At the end of the business day - If this option is chosen, the data monitor will execute depending on the value chosen in the Business Day End field. For e.g., if the business end time specified is 5 PM (default value), the data monitor will execute exactly at 5 PM
Monitor every X minutes/hour - You can define specific intervals during the business hours when the data monitor should execute. The options available are Minutes and Hours.- Minutes - Select the number of minutes after which the data monitor should execute. E.g., 30 minutes means the data monitor will execute once every 30 minutes.
The minimum time interval supported is 15 minutes, which means the data monitor will execute 4 times (15 minutes x 4 = 60 minutes) in an hour. - Hours - Select the number of hours after which the data monitor should execute during the business hours. E.g., 2 hours means the data monitor will execute once in 2 hours between 9 AM and 5 PM. The minimum time interval supported is 1 hour.
- Minutes - Select the number of minutes after which the data monitor should execute. E.g., 30 minutes means the data monitor will execute once every 30 minutes.
- Start and End Date - This section can be used to define advanced settings for data monitoring. You can define a date range (from the date and to date) when you want the data monitor to execute. You can set up a data monitor to start, say, on a Monday and end on the next Tuesday. In addition to this, you can set up the other settings mentioned above in the previous steps. This means the data monitor will only start to run next Monday and will not execute after Tuesday.
- Summary - The summary information will automatically be populated based on the information selected in the previous columns
- Save - Once all the values are selected in the previous steps, click Save to save the settings
- Cancel- Click Cancel to discard the changes.
Data Monitoring Execution Results
Once the schedules are created, it will get executed on the specified time frame. Once after the execution of schedules, it will be displayed in the data monitoring dashboard. You can go to the data monitoring dashboard and click on the respective schedule to view the data monitoring schedule execution results.
![]()
Once the Tracking Data Monitor is created and configured, it will execute during the specified time intervals. The Data Monitoring dashboard will display the status of the Tracking Data monitor on a specific date at a specific time interval in the calendar chart control.
Based upon how you configured your Data Monitoring alarm, emails might get triggered to the email id(s) which are specified while creating that Data Monitoring alarm.
The email alert(s) will contain the Tracking Data Monitor Execution Results of the data monitor. By default, if you only selected the 'Use this alarm for Process Monitor Alerts' option, you will only receive the Failure emails to the configured email address(es). Alternatively, if you also selected the 'Notify on Success as well' option, you will receive the success alert emails as well to your mailbox. The following screenshot depicts a successful email notification received for a configured Tracking Data monitor.
The email notification provides the detailed status of the data monitor - the status of execution, the warning & error count as defined in the data monitor, and the actual count of service instances that were in the particular state when the data monitor executed.
A link to the KB article is included in the data monitoring alert mail if the resultant service instance is already documented in KB, which helps in quickly resolving the problem. To get the link BizTalk360 hosted URL must be added in the settings->System Settings-> Data Access ->BizTalk360 Hosted URL.
Was this article helpful?