Tracking Queries - Message Flow Viewer
- 29 May 2024
- 4 Minutes to read
- Print
- DarkLight
- PDF
Tracking Queries - Message Flow Viewer
- Updated on 29 May 2024
- 4 Minutes to read
- Print
- DarkLight
- PDF
Article summary
Did you find this summary helpful?
Thank you for your feedback
Being a powerful publish-subscribe engine, one of the biggest challenges in BizTalk Server is to understand the message flow within the system. If you got a more complex, very loosely coupled system, the challenge gets worse diagnosing/understanding the message flow. It's every single BizTalk person's wish to see an end-to-end graphical message flow within the system as this will greatly reduce the time taken to diagnose issues and helps to get a better understanding of how your application is designed.
How is it different from Message Flow in BizTalk Admin Console?
The Tracking Queries feature is where we put it all together. It assists to visualize the entire message flow in one page/view. It encapsulates all service instances, send port, orchestration, and receive port details. With regards to message all message properties can be viewed plus the context and the actual content of the message can also be viewed.
Tracking Queries viewer gives an overview perspective, a summary of the entire message flow, and also point by point perspective of all components involved in message flow right through the intricate content of a message.
The most important aspect of the BizTalk360 Tracking Queries feature is that it can be easily grasped. It doesn't demand any BizTalk experience. Using the Graphical Message Flow viewer a message flow in a business process can be understood with ease.
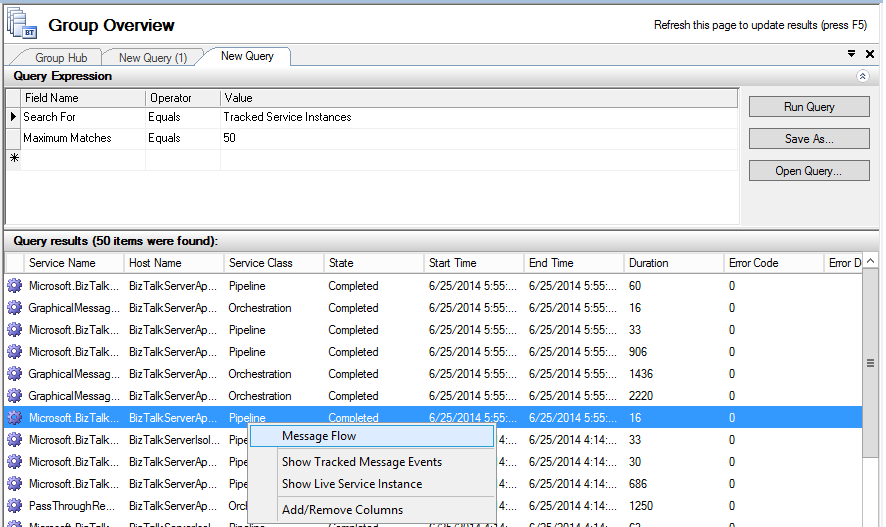
To explain the difference of Tracking Queries viewer with BizTalk Administration Console Message Flow interface, Let us take a complex business process where a message flow involves one receive port, multiple orchestrations, and send ports. In Tracking Queries viewer this process is represented as in the following image.
In the above screen, you've got a consolidated graphical view, from here you can access everything you require e.g., service instance properties, receive port, send port, orchestration details, message properties, context, and content.
BizTalk Administration Console provides message flow details in a textual format as follows
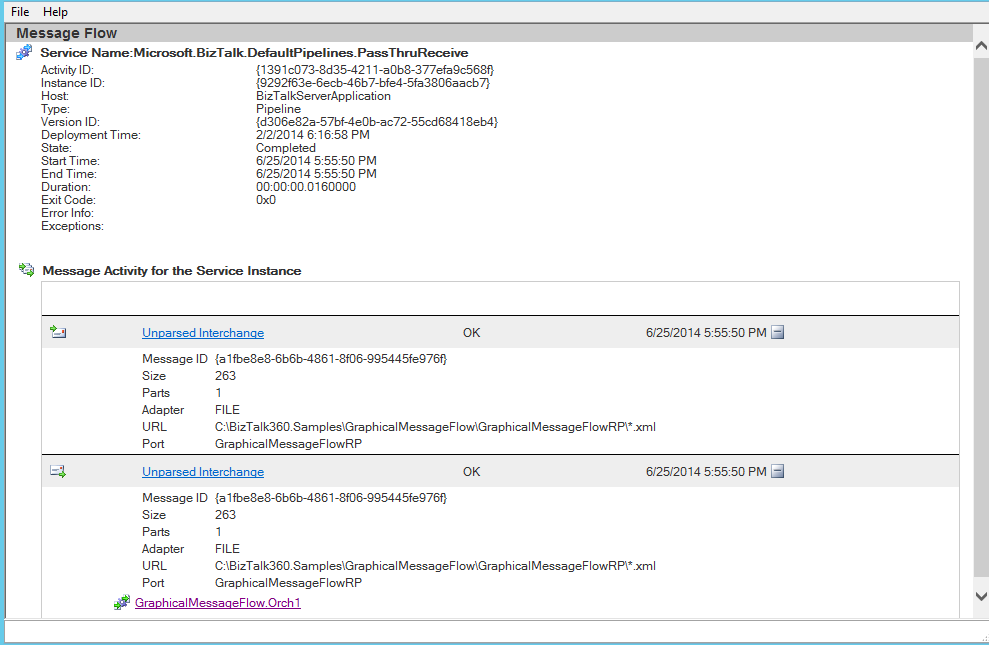
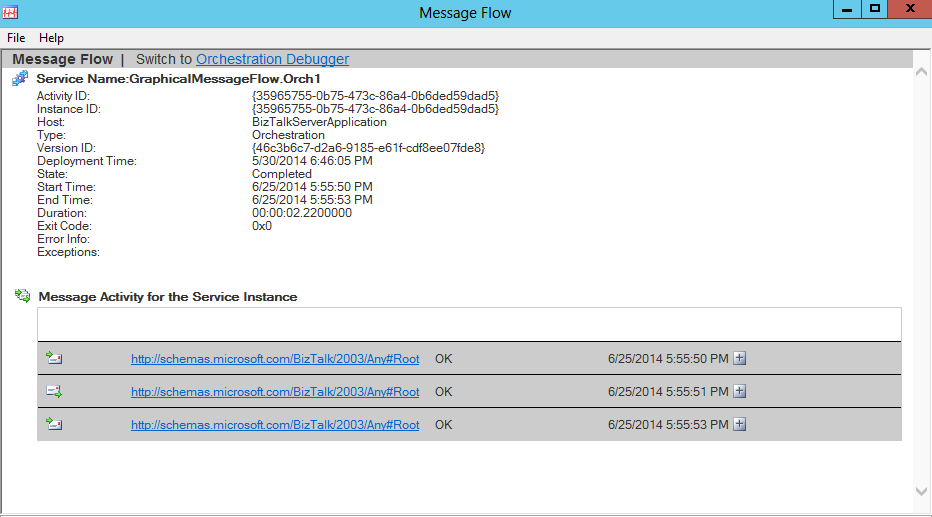
As you can see, to show the key parts and their relations at a glance the graphic representation is much better than textual representation, thereby allowing a holistic understanding that textual representation alone cannot convey.
Tracking Query Interface
Tracking Queries viewer constructs visualizations of message flow and assists people to see things that were not obvious to them before. Even when data volumes are very large, patterns can be spotted quickly and easily.
The viewer shows you what messages a service instance (pipeline or orchestration) sent and received, and details such as the URL, port, and party used. You can also see which preceding service instances handled the messages coming into the service instance you are currently viewing. You can link back to these instances and see the messages coming into and going out of these instances. You can also see the subsequent service instances that received messages from the service instance you are currently viewing, and link forward to these instances to see the messages coming into and going out of these instances. In other words, you can walk through the entire path of an activation message through your business process.
The Message Flow UI has two panels(Left & Right). The left panel area exhibits a message flow viewer. The right panel exhibits a tabbed interface with three tabs(Properties, Context, Content). The viewer panel has three groups Receive Ports, Orchestrations, and Send Ports. A service instance of the type Receive/Send pipeline will be placed under receive / send ports. An Orchestration service instance will be placed under Orchestrations.
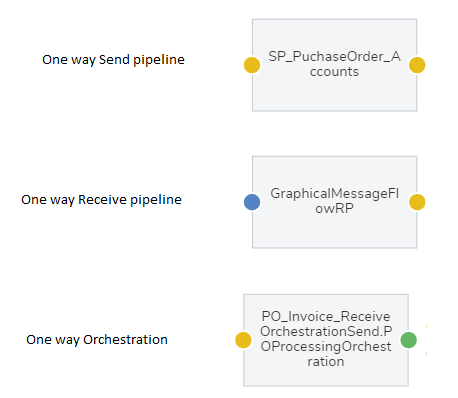
Service instances with a one-way port
In/Out message for a service instance is represented in color-coded circle
Tracking Queries FAQ
What are the pre-requisites for Tracking Queries?
Tracking Queries depend on tracking data. By default global tracking is enabled at the BizTalk group level. However you suddenly notice that no data is being tracked by BizTalk., the first place to check is the Pipelines Tracking configuration.
In the BizTalk Server Administration console tool, expand BizTalk Server Administration and expand the BizTalk group containing the pipeline for which to configure tracking.
Do one of the following:
- To configure tracking for one of the default BizTalk pipelines, expand All Artifacts
- Click the Pipelines folder, right-click the pipeline, and then click Tracking
- Make sure that checkboxes under Track Events are enabled
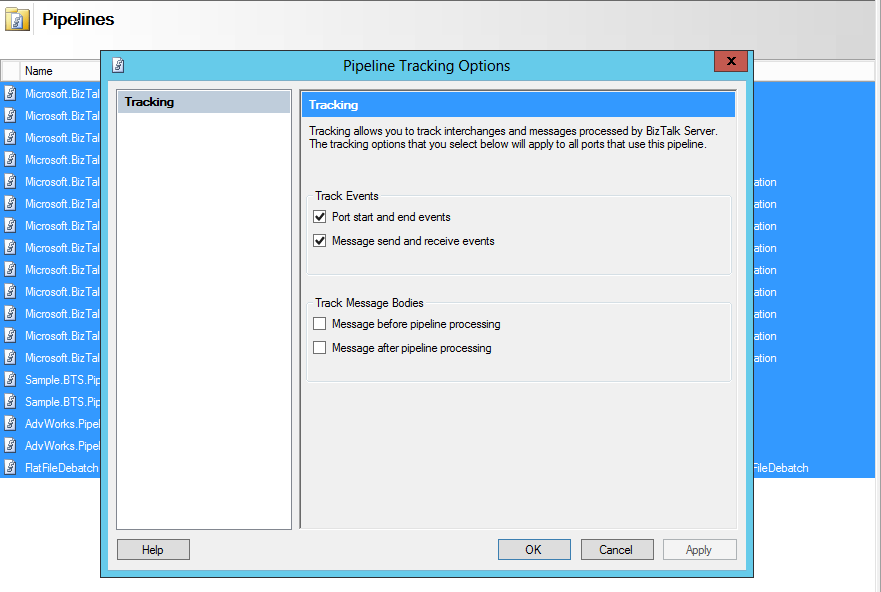
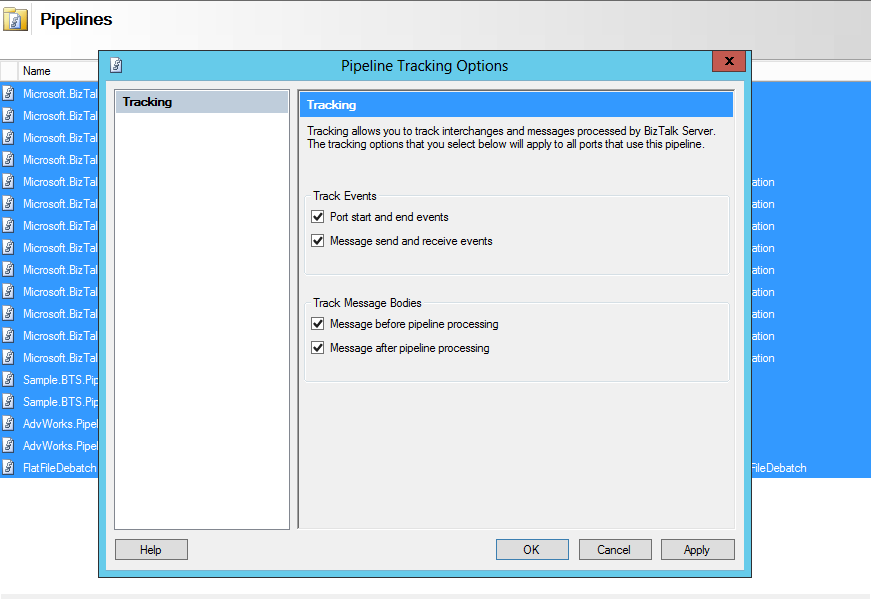
To enable tracking for messages, make sure that checkboxes under Track Message Bodies are enabled( this will pull message context and content in Tracking Queries Viewer)
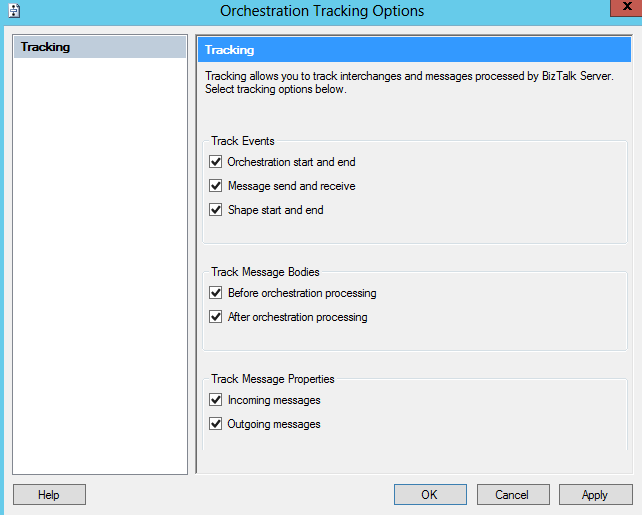
To track Orchestration events and messages enable tracking for the Orchestration as shown in the below image
Is there any performance impact using Tracking Queries?
The tracking Queries option doesn't have any impact on BizTalk applications at runtime. There is no pre-fetch of data, we use the same mechanism as the BizTalk administration console(BizTalk API's). There will be no impact in accessing Tracking Queries Viewer in BizTalk360.
There will be a performance impact when you enable tracking for message bodies. This also applies to the BizTalk administration console.
How do Tracking Queries work under the hood?
Tracking Queries viewer uses the same components to fetch message flow data as the BizTalk administrator console. There is no pre-fetch of data. Data for message flow is pulled as you click the message points in the Graphical Message Flow Viewer. There is no performance impact for your existing BizTalk applications.
The tracking Queries option demands data as and when required, for instance when you prefer to see the context and content of a message, the data is fetched when you click on a message.
Is there any custom development required for Tracking Queries?
There is no custom development required for the Tracking Queries feature, it uses the BizTalk Server tracking infrastructure to plot the message flow in the viewer. You can visualize the message flow in your environment, once you install BizTalk360 and if tracking is enabled in your environment.
The installation process of BizTalk360 is simple and there is zero configuration to visualize the message flow.
Was this article helpful?