v10.5
- 02 Feb 2023
- 3 Minutes to read
- Print
- DarkLight
- PDF
v10.5
- Updated on 02 Feb 2023
- 3 Minutes to read
- Print
- DarkLight
- PDF
Article Summary
Share feedback
Thanks for sharing your feedback!
Release Date: 31st January 2023
 New features
 New features
Performance Queries
In the Administration section, the new Performance Queries feature is introduced with rich filtering options, and saved query capabilities and is combined with granular user access policies. The feature uses Analytics performance and Tracking data for selected metrics.
Automated Tasks - NT Services
The administrator can utilize Automated Tasks to automate the operations of NT Services (Start, Stop, Restart, Pause, Resume) in BizTalk/SQL Servers for their regular routines. Cluster NT Services operations are managed with At Least One Active action.
BizTalk Performance Monitoring (Data Monitoring)
In Data monitoring -> Performance, you can monitor the BizTalk Messaging performance with the metrics Message Count, Average Execution Time and Message Delay. Also Host performance metrics like Average Execution Time, Instance Count, Host CPU & Memory usage and Transmission Failure Rates can be monitored.
User Experience Improvements
Improved the user experience of interfaces throughout the application
- Smooth grid operations
- Indicate the load time with the liquid loader
- Refreshed menu styles and icons
 Enhancements
 Enhancements
Automated Tasks Improvements
- PowerShell Scripts in Custom workflows: The PowerShell script execution step is incorporated in the custom workflow Automated Task
- Retry failed Tasks: In the Automated Tasks feature, handled the retry of the failed steps based on the retry configuration.
- Alarm configuration conflict: Indicate to choose the alarms for the artifacts which generate false alerts or conflict states in auto-correct scenarios.
- Clustered Host Instances: In the Host Instances task and custom workflow actions will be performed against the active node of Clustered Host Instances.
- Governance Audit: Capture the activities of Automated Tasks configuration, execution of manual triggers and schedule tasks in Governance & Audit.
Azure Service Bus Queues and Topics & Subscription Monitoring
Azure Service Bus Queues are monitored under Azure Services. As like Logic Apps, BizTalk360 now lists the Azure Service Bus Queues and Topics for the Azure Subscriptions.
BHM monitoring in High Availability
In BizTalk360 high availability, determine the status of BHM Profiles from the latest report generated. Indicate the latest BHM report generated server in the notifications and alarm mapping section.
IBM MQ supports Host Name
IBM MQ monitoring supports the host name now, along with the IP Address in the queue configuration.
Analytics
- In Analytics widgets, we brought the option to compare the data of the previous day, week and month.
- Analytics services now determine the Direct Port binding messaging patterns.
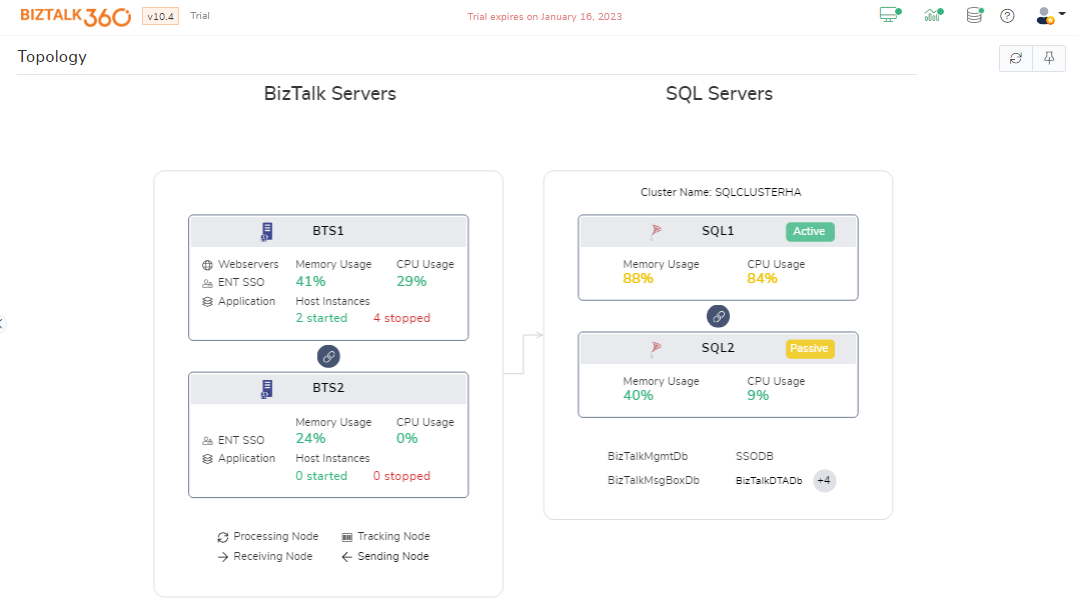
Topology Improvements
SQL Server's high availability indication of load balancing servers. Also, BizTalk360 lists the databases available in the SQL Server instances.
Governance Audit
- Capture the audit activities of BizTalk port and transport level configurations.
- In governance audit, allow the selection of multiple values in the filter component.
Scheduled Maintenance
During the scheduled maintenance window, provide the indication about the schedule with the name, the reason for maintenance and the user who created the maintenance in Administration, Monitoring and scheduled maintenance.
Custom Notification Channel
In custom notification channels, users can choose the features (Alarms, Reporting and Automated Tasks) that can be used by notification channels.
 Bug fixes
 Bug fixes
Administration
- Manage Infrastructure -> Host: The issue of displaying duplicate Receive Locations under Host is fixed
- BizTalk Services -> EDI: NT Group users are not able to view Parties & Agreements when granting All Parties & Agreements permission
- BizTalk Services -> Tracking Manager: Clicking on the application is not redirecting to artifacts port configuration page
- BizTalk Services -> BAM: First column selection is not working for the order by columns
- BizTalk Services -> ESB: Tooltip is not showing up when hovering over the exception message
Monitoring
- Data monitoring schedule has sent notifications every minute after the business hours
- In Manage mappings "At least one active" is not shown for the clustered NT Services
- MSMQ queue monitoring, the server name is included for the remote queues in alert notifications
- For group dashboard monitoring, full-screen mode is collapsed to the normal window after the refresh interval
Settings
- In Team management, sorting is enabled for the user name
Was this article helpful?