What are Messaging Patterns in BizTalk360?
Usually, when you have a complex BizTalk application, the message passes through multiple artifacts creating different patterns. Messages that contain repetitive patterns can cause excessive memory use, causing the database to fill quickly. To handle such situations with BizTalk360, you can automatically identify all the messaging patterns existing in your BizTalk environment and record only the unique patterns. With the Messaging Patterns feature, you can trace the path of the message and understand how the artifacts are related to each other.
BizTalk360 has the functionality to allow users to view the graphical flow of messages within your BizTalk Group. The Graphical Message Flow Viewer constructs visualizations of message flow and displays them in a nice graphical way with all the details of the ports and orchestrations through which the message travelled through the system.
The challenge with Graphical Message Flow Viewer is that, for instance, if there are 100 messages passing through the system at a particular point of time, each message is tracked at the service instance level with a unique id. At an operational level, this is very useful. However, it does not give any insight into the number of transactions that are processed by BizTalk Server.
To solve this problem, BizTalk360 introduces the capability of Messaging Patterns to visualize the list of message flows that has happened in the system. The key difference from Graphical Message Flow Viewer is that, in the message flow list, only the unique messaging patterns get recorded. As in the previous case, if there are 100 messages passing through the system at a particular point in time, not all the 100 message flows are recorded in the Messaging patterns. Only the unique message patterns are recorded, which could be just, say, 15 or 20.
In BizTalk360, Messaging Patterns is a part of the "Analytics" section that hosts the Performance Analyser Dashboard and the Throttling Analyser
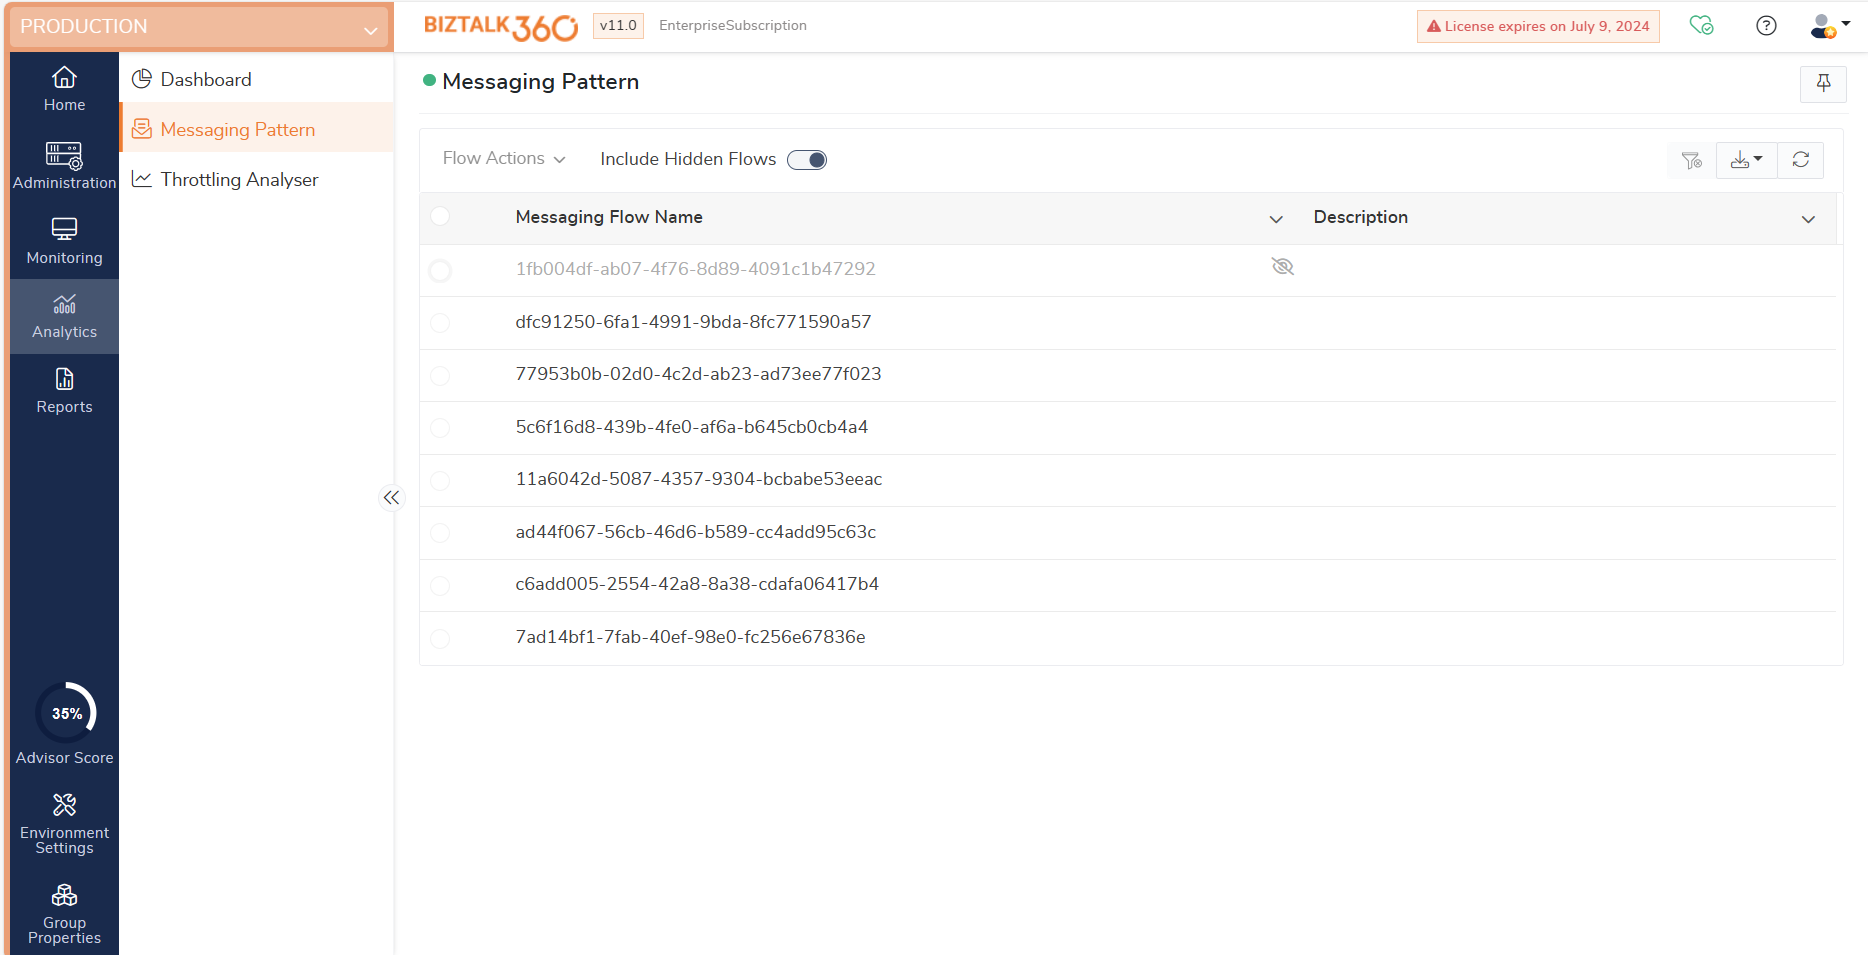
Data Flows Screen
Here, we will take a detailed look at the data flows screen to understand the functionality better.
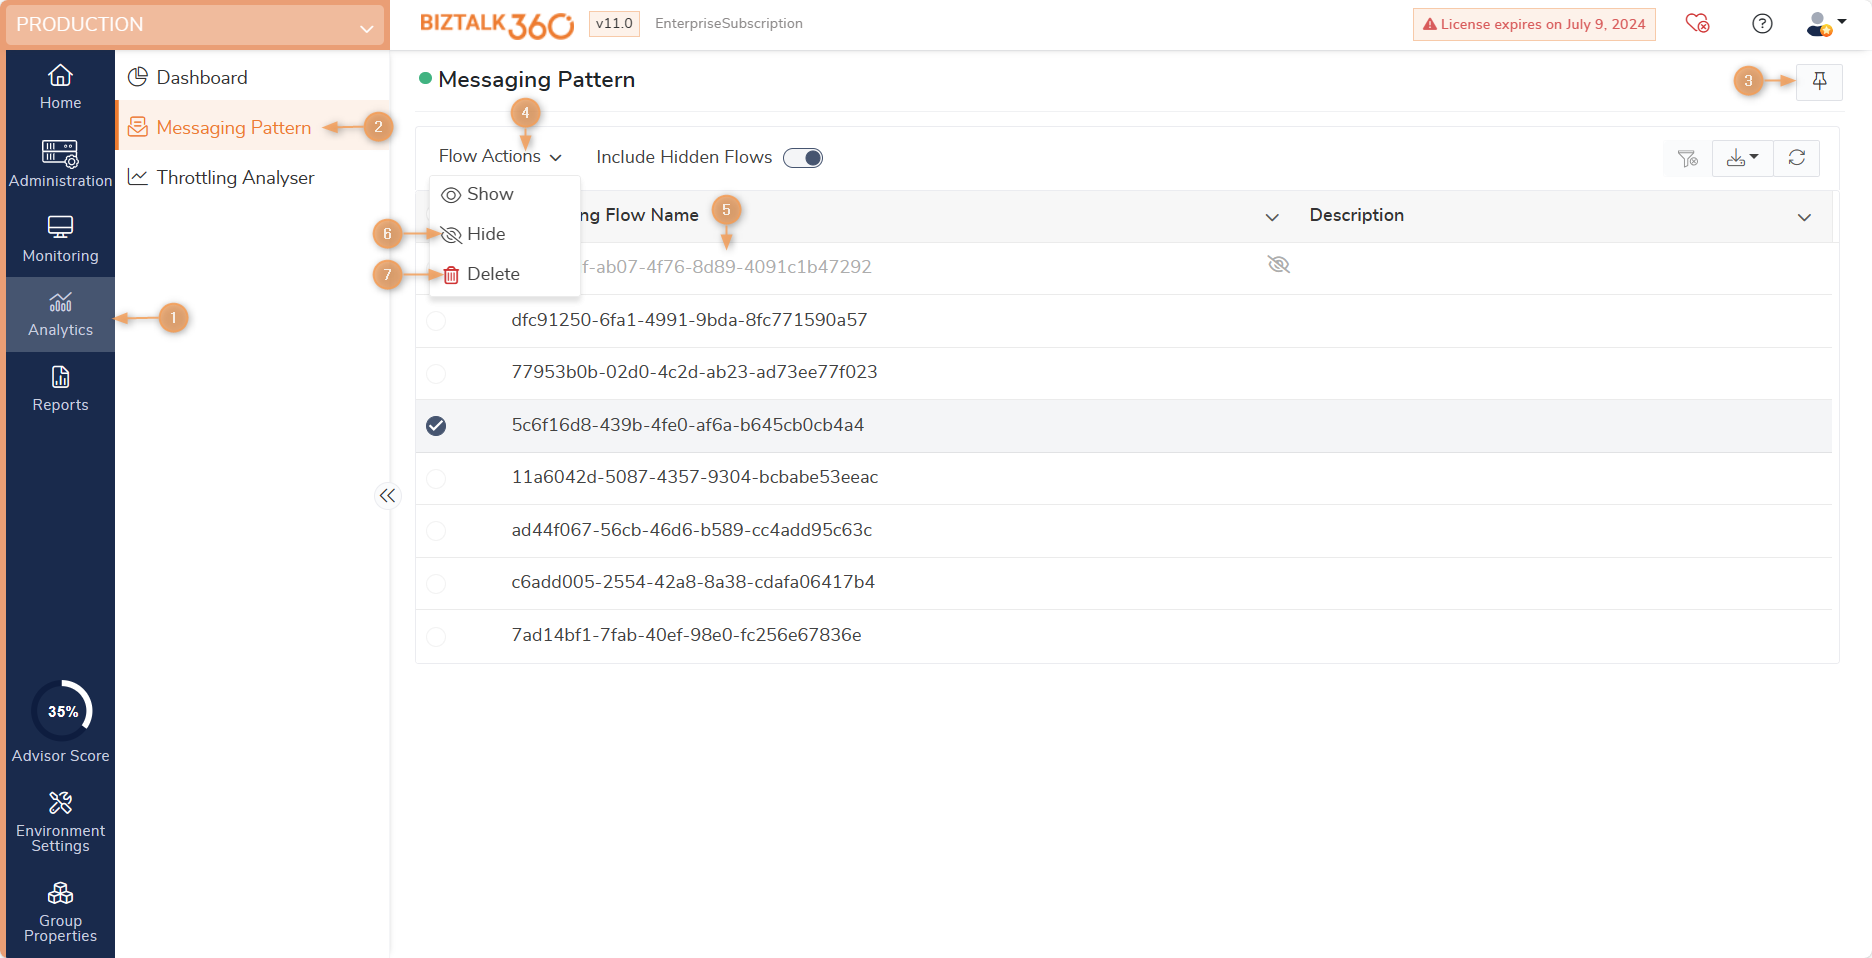
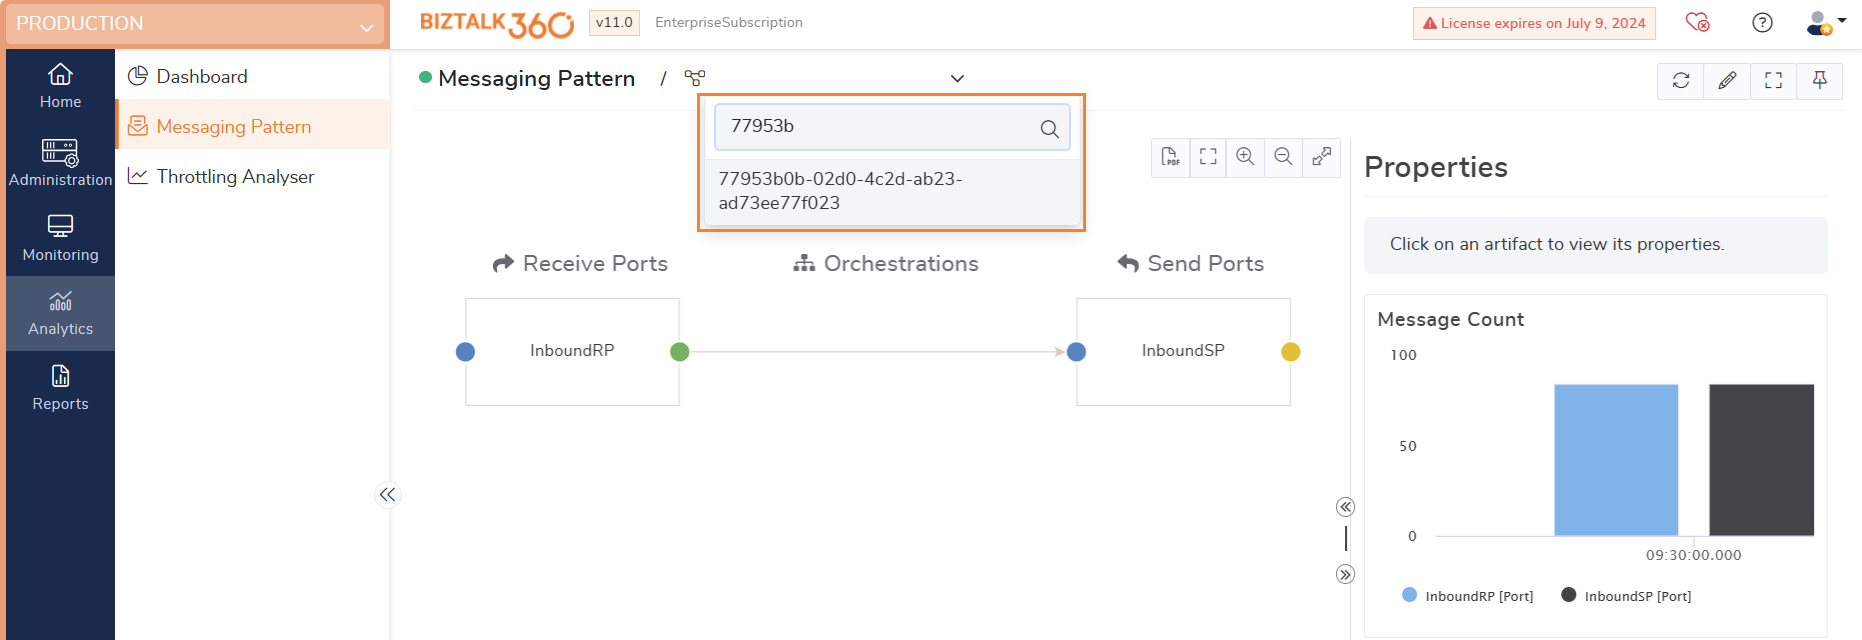
- Analytics Section - The 'Analytics' section houses the Performance Analyser Functionality, Messaging Patterns, and Throttling Analyser.
The green visual indicator next to Analytics means that the BizTalk360 Analytics service is running perfectly fine. If there is any problem with the Analytics service, you will notice a red indicator next to Analytics. To look into the reason of an issue, you can navigate to the Analytics Service Status section under the BizTalk360 Health section in BizTalk360 settings. - Messaging Patterns - Select Messaging Patterns to view the message flow list for the particular environment.
- Pin to Dashboard - Click the Pin icon to pin the Messaging Patterns to the Operations Dashboard. By pinning the flow list to the dashboard, you can easily access the flow list from the dashboard, with a single click. Once on the dashboard, you can customize the widget according to your convenience (resize to different sizes like Normal, Small, Mini). For more information on the dashboard and its customization options, please refer to the Dashboard section. When you click the pin icon, the Messaging Patterns will be pinned only to the operations dashboard and not on the analytics dashboard.
- Messaging Flow Pattern - Displays the list of unique message flow patterns based on the messages that have passed through the system. The value will be a set of alphanumeric values that will be displayed as it is from the database.
- List All the Messaging Flow Patterns - In the initial load, only the active Messaging Patterns will be listed. Enabling the option "Include Hidden Flows" will list all the flows including the hidden flows.
- Hide - To hide or show the Message Flow Pattern by toggle switch the option.
- Delete - Click the Delete icon to delete the Messaging Flow Patterns.
- Edit - Click the Edit icon to edit the Messaging Flow Pattern and Description information for the Messaging Flow. You can choose to enter a meaningful name in the pattern name and description section. For more information about how to edit the details, please refer to the Editing the Messaging Flow Pattern Details section.
 Export to Excel - Click the 'Export to Excel' link to download the grid values in .xls format.
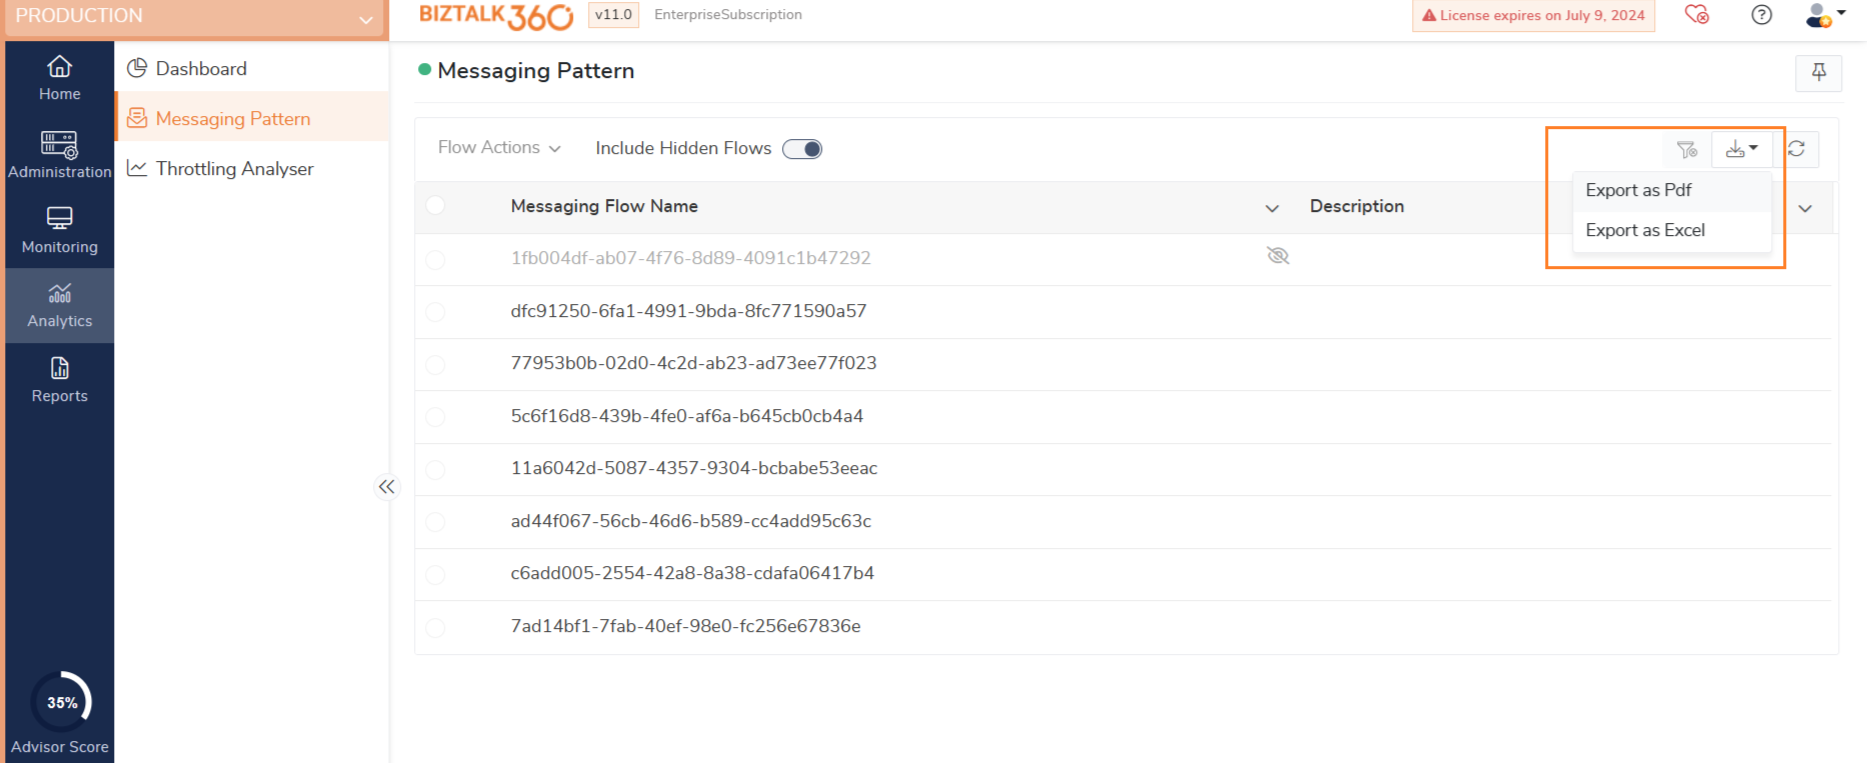
Refresh - Click the Refresh button to refresh the Messaging Patterns
Search Flows - Use the Search Flows box to search for a particular flow. Start typing in the box and you will notice that the messaging flow pattern values will change depending on the entered value.
Editing the Messaging Flow Pattern Details
In this section, we will see the steps to be followed to edit the message flow pattern details. As mentioned earlier, the message flow pattern details value will be displayed as a series of alphanumeric values as it is from the database. BizTalk360 provides the functionality for the users to edit the messaging flow pattern details information to a more meaningful name as per their convenience. To modify the flow details, click the Edit button (represented with a pencil icon). You will notice the 'Modify Flow Details' window appearing in a blade.
- Messaging Flow Pattern - Enter a meaningful name for the flow pattern. For instance, MessageThruOrchestrationToSendPort
- Flow Description - Enter a meaningful description to define the message flow pattern.
- Save - Click Save to save the information. Once the information is saved, you will notice that the details are reflected in the Data Flows section.
- Cancel - Click Cancel to cancel any changes made to the message flow information.
It does not just end with viewing the message patterns, but users also have the ability to rename the message flows to a meaningful name (since the flows appear with the flowUId alphanumeric value from the database) with a meaningful description so that they know what is unique about a particular message flow that happened in the system. In addition, users also have the ability to view the transaction volume at each port in the flow (say, receive ports, orchestrations, and send ports).
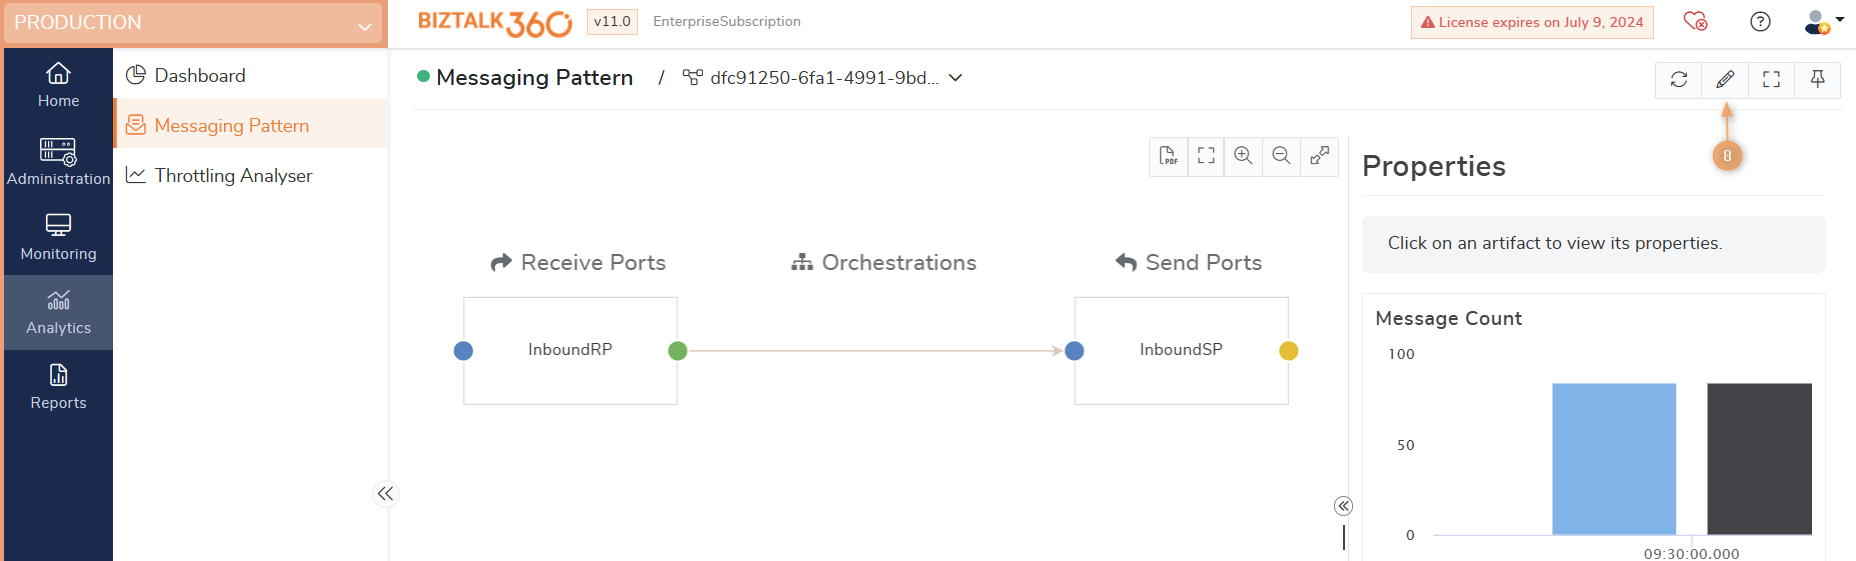
Message Count and Average Execution Time
Here, we will take a detailed look into how the Message Patterns depict the message count and average execution time of the messages that passed through the system. In addition, the feature also has the capability to display the transaction volume at each port level (receive port, orchestration, send port) in the message flow.
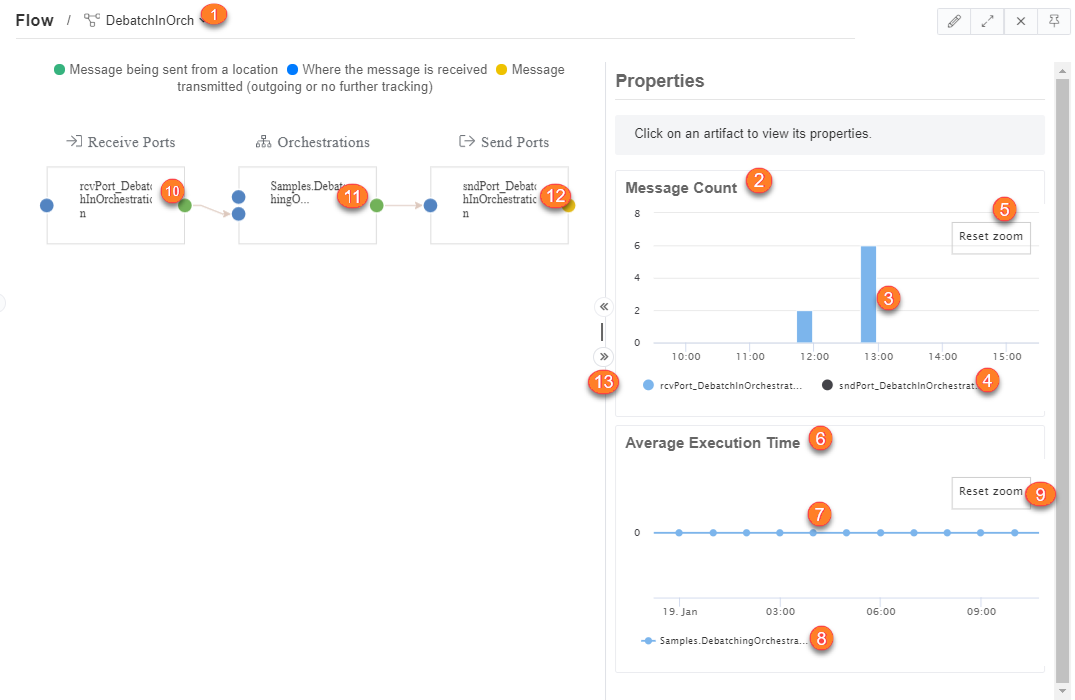
1. Messaging Flow Pattern Name - Select the messaging flow pattern name from the list in the left-hand side menu, to view the additional properties such as Message Count and Average Execution Time.
By clicking the edit (pencil) icon, the Message Pattern title becomes editable, and we can modify the title or add a new name according to the requirement.
The following validations have been added for the Message Pattern title.
- Flow name must be unique.
- Other than '-', special characters are not allowed.
- A flow name cannot be empty.
- Only Super Users can edit the message title.
2. Message Count - Displays the number of messages that have flown through the system in a graphical manner. The graph displays the message count for the last 24 hours. The values are refreshed once every 60 seconds.
- Graph points - The graph points are depicted in different colours for the different ports. The points are plotted on a graph with the X-axis depicting the time interval and the Y-axis depicting the message count. The time interval, by default, displays on a 24-hour scale. When you hover over the data points on the graph (on the X-axis), you will notice the name of the port, the average message execution time (in milliseconds), and the timestamp of the message execution. You can click and drag within the graph area to zoom in to the graph and display the time intervals on an hourly basis. Say, you want to see a specific time period (21:00 to 03:00), click and drag the mouse on the graph area between the time intervals. You will notice that the graph gets expanded to the selected time period range.
- Legend - Depicts the legend for the different ports in the system. Click the legend to either display/hide the values for the corresponding port in the graph. For instance, if you only want to view the orchestration average execution count values in the graph, click the receive port legend and the send port legend. You will notice that the legends get grayed out when you click on them and only the orchestration legend will be in the enabled state. You will notice only the orchestration value will be displayed on the graph.
If you disable all the legends, there will be no graph displayed and you will see the message "No data to display". - Reset Zoom - Click the button to reset the graph back to the original state (24-hour period visibility).
3. Average Execution Time - Displays the average execution time for the messages that have flown through the system in a graphical manner. The graph displays the average execution count for the last 24 hours. The values are refreshed once every 60 seconds.
- Graph Points - The graph points are depicted in different colours for the different ports. The points are plotted on a graph with the X-axis depicting the time interval and the Y-axis depicting the average execution time (in milliseconds). The time interval, by default, displays on a 24-hour scale. When you hover over the data points on the graph (on the X-axis), you will notice the name of the port, the average message execution time (in milliseconds), and the timestamp of the message execution. You can click and drag within the graph area to zoom in to the graph and display the time intervals on an hourly basis. Say, you want to see a specific time period (21:00 to 03:00), click and drag the mouse on the graph area between the time intervals. You will notice that the graph gets expanded to the selected time period range.
- Legend - Depicts the legend for the different ports in the system. Click the legend to either display/hide the values for the corresponding port in the graph. For instance, if you only want to view the orchestration average execution count values in the graph, click the receive port legend and the send port legend. You will notice that the legends get greyed out when you click on them and only the orchestration legend will be in the enabled state. You will notice only the orchestration value will be displayed on the graph.
If you disable all the legends, there will be no graph displayed and you will see the message "No data to display". - Reset Zoom - Click the button to reset the graph back to the original state (24-hour period visibility).
4. Receive Port Properties - Click on the receive port to view the port-specific properties (message count and average execution time). This will display information only about the selected port in the graph view (as shown in the picture below). In addition, click on the receive port name to view the details about the message properties (such as General Receive Port details, associated receive locations, inbound maps, and the tracking information).
All information in the Message Properties screen is completely Read-Only.
5. Orchestration Properties - Click on the orchestration to view the port-specific properties (message count and average execution time). This will display information only about the selected port in the graph view (as shown in the picture below). In addition, click on the orchestration name to view the details about the message properties (such as General Orchestration details, Bindings, and Tracking information).
All information in the Message Properties screen is completely Read-Only.
6. Send Port Properties - Click on the send port to view the port-specific properties (message count and average execution time). This will display information only about the selected port in the graph view (as shown in the picture below). In addition, click on the send port name to view the details about the message properties (such as General Send Port details, Primary Transport, Backup Transport, Outbound Maps, Filters, and Tracking).
All information in the Message Properties screen is completely Read-Only.
7. Expand/Collapse Pane - Click the < to collapse the Graphical Message Flow view section and expand the graph section to the full view. Click > to expand the Graphical Message Flow view section back to the original position. This will shrink the size of the graph view section as shown in the image below. Click, hold, and drag the mouse on the | to custom set the size of the Graphical Message Flow view and the graph section as shown in the image below.
What are the Analytics Services associated with Messaging Patterns?
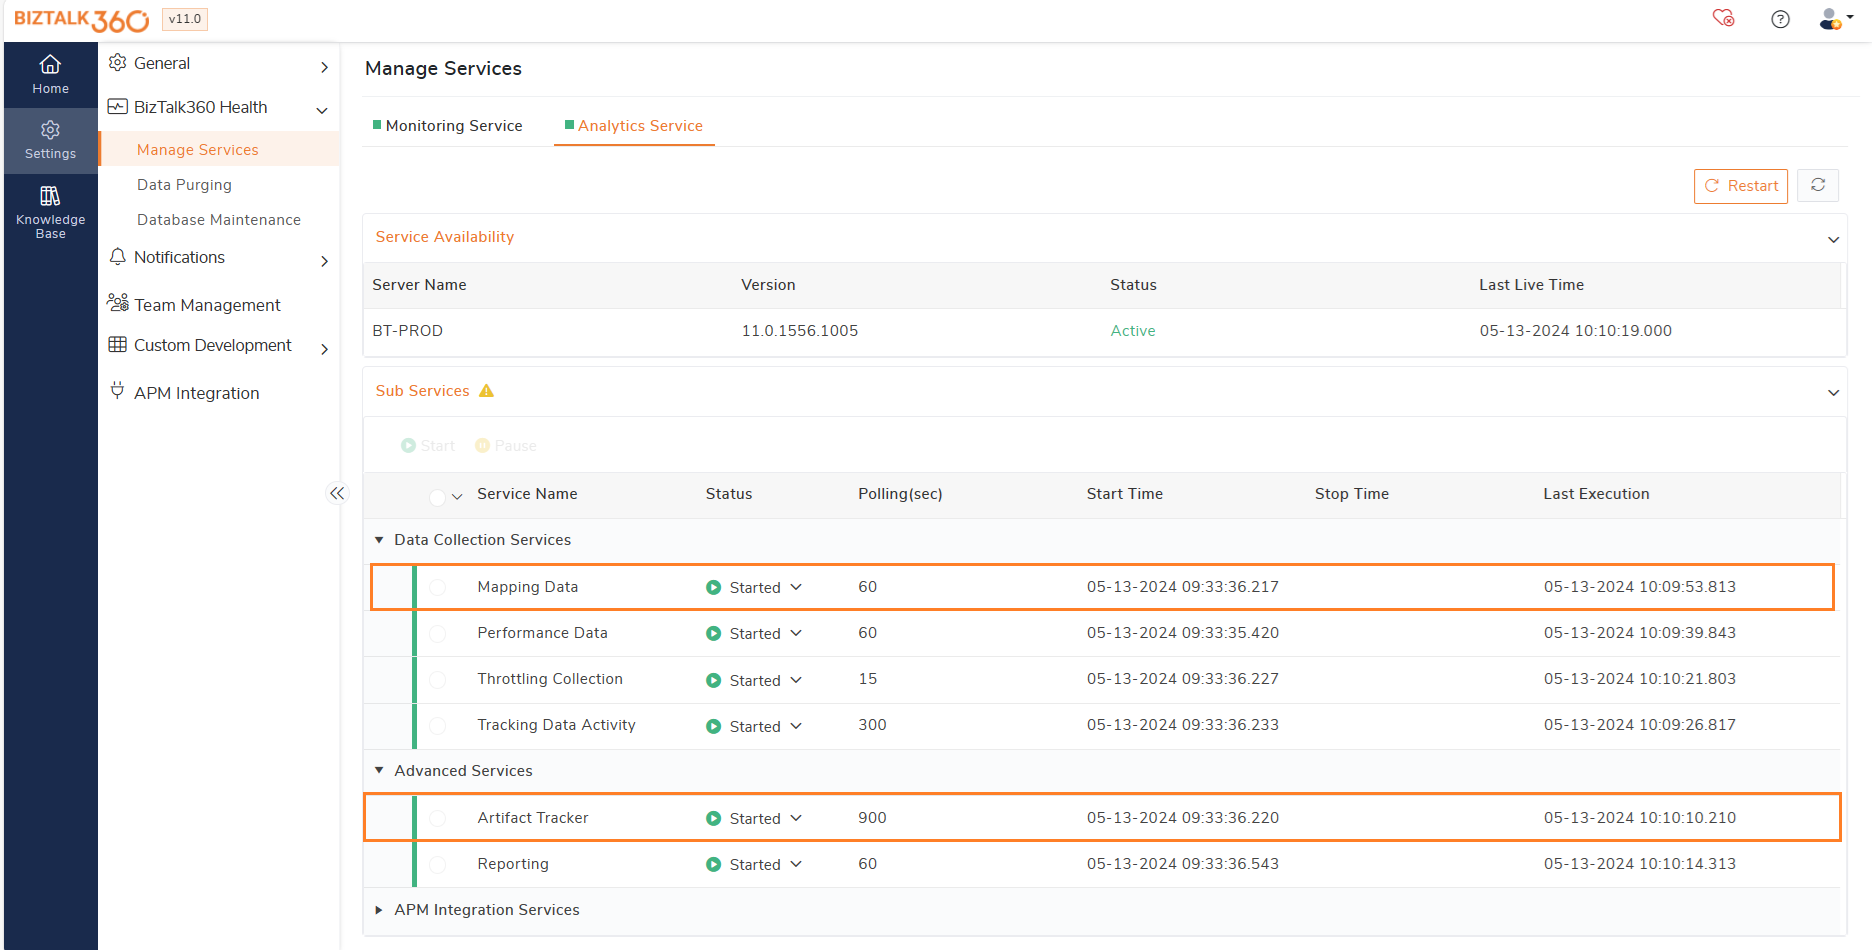
In order for Messaging Patterns to work, there are few backend services that are responsible for keeping track of the unique message flows from the various messages that pass through the system every day. It is important that these services are running in a healthy state in order for the message flows to be stored and displayed in the user interface. The two main services associated with Messaging Patterns are:
- Artifact Tracker.
- Mapping Data.
You can view the health of these artifacts under the Analytics Services Status section in BizTalk360 Health under BizTalk360 Settings.
Points to Remember regarding Messaging Patterns
Here are the important points to remember when working with BizTalk360 Messaging Patterns functionality:
- Make sure you have enabled tracking at the 'Pipeline' level for the unique data flow data to be captured by the Analytics service.
- Message Count and Average Execution Time graphs are displayed for a 24-hour period. Click and drag the mouse on the graph to zoom in into the graph data. To reset the graph, click the Reset button.
- The Analytics service has a refresh interval of 15/60 seconds.
- Date and Timestamp values displayed in the graph depends on the User Profile setting (Click the user icon at the top right corner of the page and define the User Profile settings)
- Super Users - Have all the rights to view the message flow, associated port information, the message count, and average execution time graphs.
- Normal Users - Have the capability to view the message flow. However, if the message flow happens through an application for which they do not have access, they will not have the privileges to view the artifact information and the graph.
- For instance, Scott is a normal user and has access only to ACME and Contoso applications in BizTalk360. When Scott tries to view the Messaging Pattern of messages that passed through the RuleTestApp application, he will see a permission denied error message.
- Normal Users do not have the permissions to edit the name and description of the Messaging Patterns
- The 'Pin to Dashboard' icon pins the Messaging Patterns to the 'Main Operations Dashboard' and not to the Analytics Dashboard
- Even though there are no purge settings for Messaging Patterns in BizTalk360, the Messaging Patterns data will be automatically purged based on the Tracking Database settings. Make sure you keep the right setting in the tracking database if you wish to retain the Messaging Patterns data for a specific period of time.