What Is BizTalk360 Throttling Analyser?
Throttling in BizTalk Server is one of the important core functionality, at the same time a complicated technical bit. The majority of the time, people struggle to understand what BizTalk host throttling is and how it’s working under the hood. You really need to have a deep technical understanding of BizTalk internals to understand throttling. Even experienced BizTalk people struggle to constantly keep up with the values of throttling state on top of their head (ex: 4-process memory, 5- system memory, 10 – user override, etc.). The BizTalk360 throttling Analyser helps to resolve this issue by giving a visual representation of throttling conditions on a near real-time basis.
How Does BizTalk360 Throttling Analyser Work?
BizTalk360 comes with a background monitoring service that is responsible for collecting the required throttling performance counter data from all the servers in the environment. It understands the BizTalk host/host instances configuration, periodically collects the required performance counter data, and stores it in the central BizTalk360 database. The default collection time is 15 seconds. The collection algorithm is optimized so that it will not collect unnecessary information. The data is persisted for 7 days, in the current version users will not be able to modify it.
The Throttling Analyser is enabled by default. There is no performance impact for using the Throttling Analyser in your BizTalk environments since we only query the available BizTalk performance counters, which already collected the required data.
Benefits Of Throttling Analyser
The idea behind the BizTalk360 Throttling Analyser is to simplify the complexity in understanding the BizTalk throttling mechanism and provide a simple dashboard view. This helps people to understand the throttling conditions in their BizTalk environment, even when they do not have deep technical expertise. A Throttling Analyser can be very useful to understand the environment's current processing capacity (whether your environment is working efficiently or under throttling conditions), and it will help to do some capacity planning on a near real-time basis.
Traditionally, BizTalk experts tried to understand throttling conditions in the environment by configuring the Windows PerfMon tool to collect 100's counters (between different host and host instances in multiple BizTalk servers), which is time-consuming. At the same time you need the expertise to understand the values you collected. Basically, you used a general-purpose performance collector tool to understand the complex BizTalk throttling mechanism. Whereas the BizTalk360 Throttling Analyser is designed to keep in mind the various challenges in understanding throttling conditions in BizTalk and providing relevant visualization to easily identify any such conditions.
Accessing the BizTalk360 Throttling Analyser
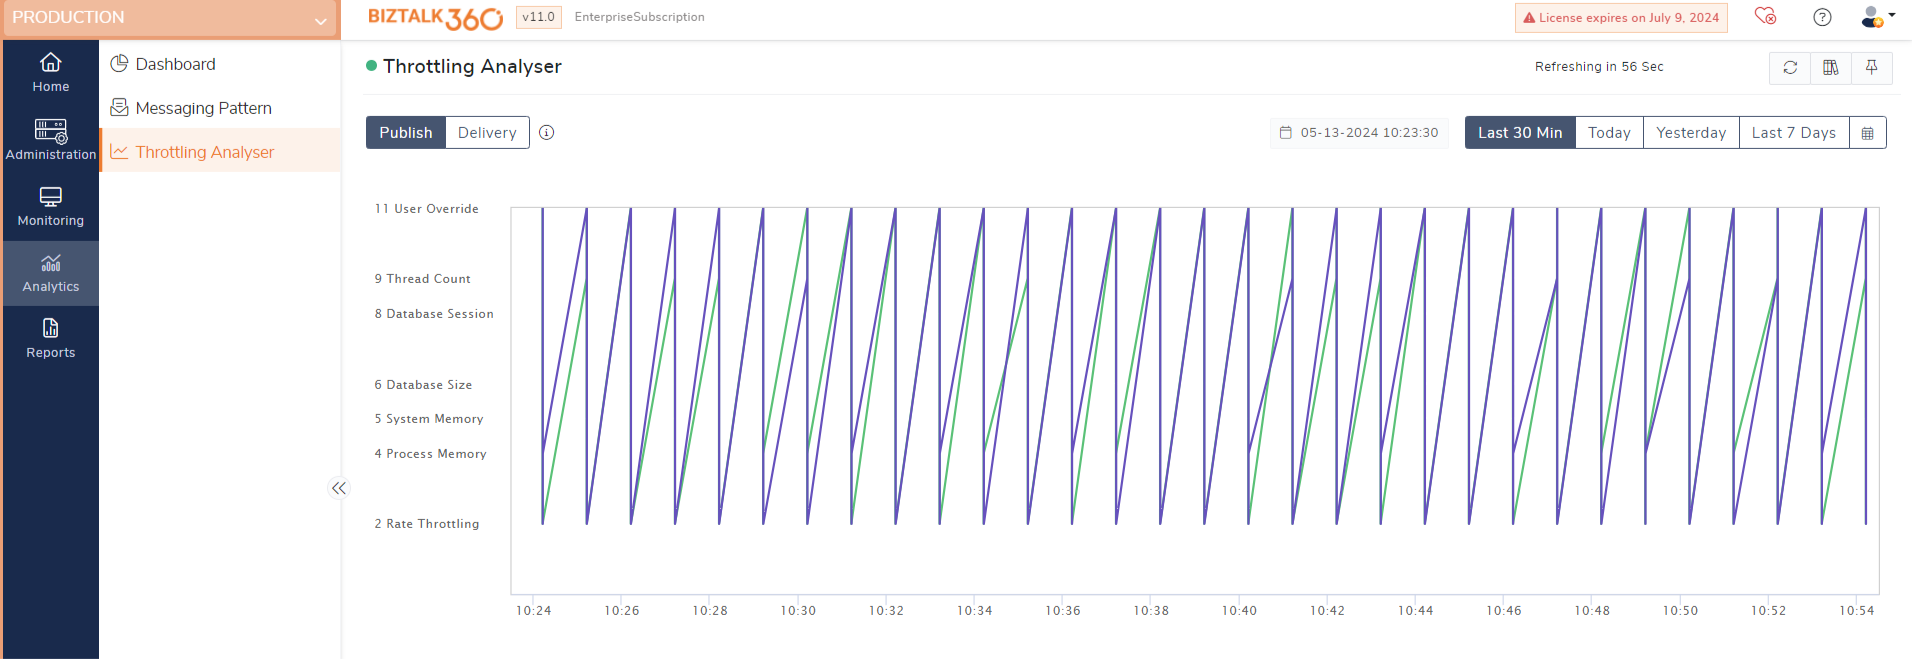
To access the Throttling Analyser, the user can click on the Throttling Analyser item in the left Menu bar, which will display the Throttling Analyzer as shown in the below picture.
Understanding the BizTalk360 Throttling Analyser
Throttling Analyser in BizTalk360 consists of the following UI Segments:
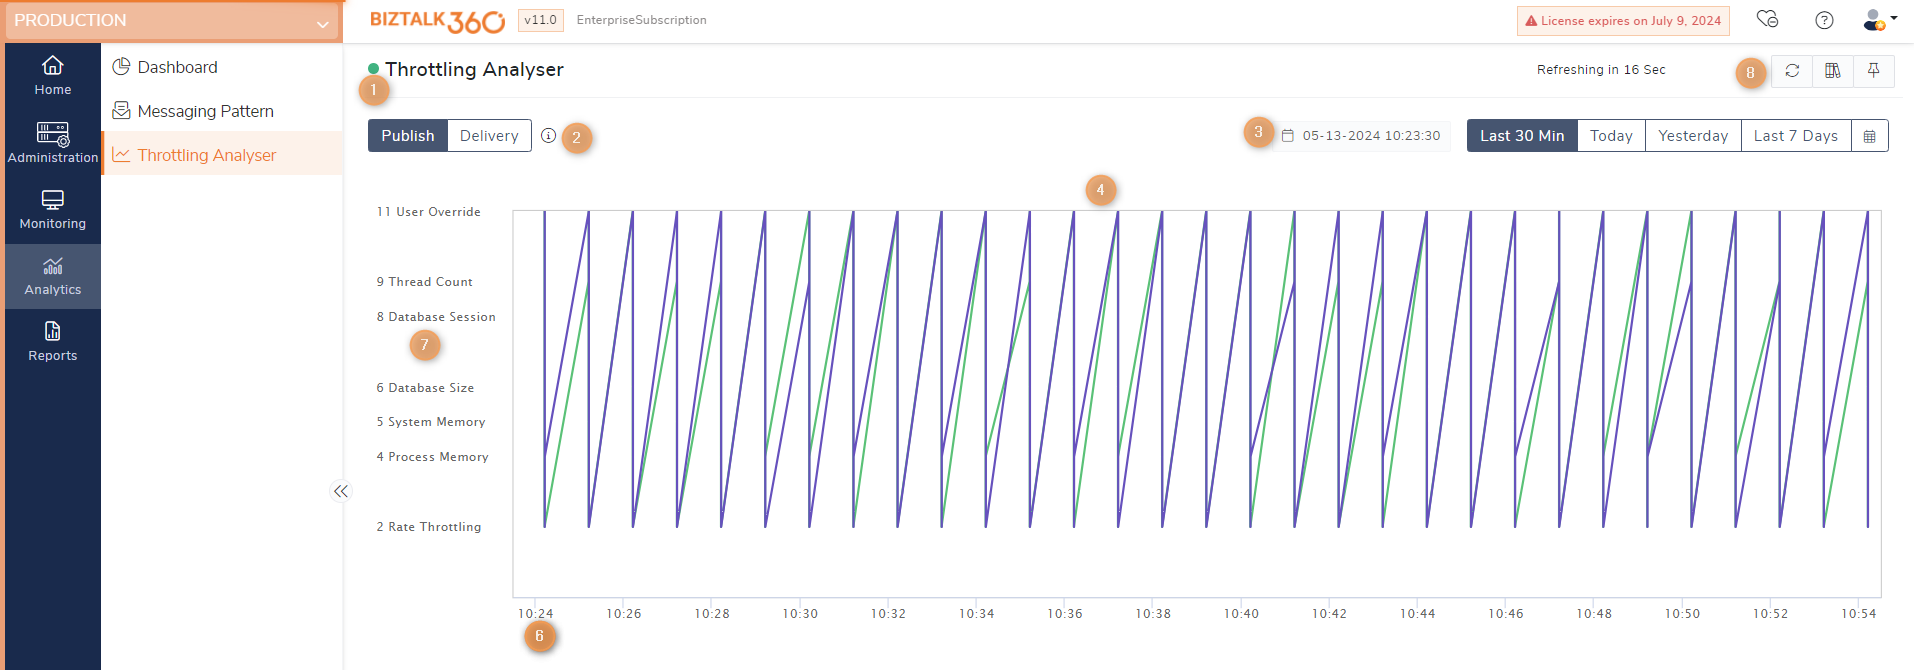
1. Throttling Data Collection Service Status - This displays the status of the Throttling Performance Collection Service. The Throttling Analyser depends on the healthy running of the background BizTalk360 monitoring service. There are 3 different statuses:
- Running - represented in 'green'
- Not running (stopped/paused) - represented in 'red'
- Unknown status - represented in 'gray'
The status also represents the last time the service collected the performance counter data. To know how to enable the throttling service, please read How to start/pause Throttling Performance Counters collection service.
2. Buttons to switch between Publish or Delivery Throttling types - Switching between the Publish and Delivery Throttling will update the chart to represent the performance counter data for the selected date-time range.
3. Options to select date and time range to display throttling data - There are four different date time ranges the user can select to see the performance counter data on the chart as desired. They are:
- Last 30 Minutes - represents data for the last 30 minutes of the current day.
- Today - represents data from 00:00 hours and the current time of the current day.
- Yesterday - represents data from 00:00 hours of yesterday to 00:00 hrs of the current day.
- Last 7 Days - represents data within the last 7 day time period from the current instance of time.
- Custom Date and Time Range - the user can select any date and time range within the last 7 days to see data within the desired date and time range. To help the user quickly see the data for the last 2 hours, by default, this option will have the date and time range selected for that timeframe. At any instance, the user will be able to see the data for the past 7 days. The maximum is based on the purging policy as explained here: How long do we store the throttling performance counter data
4. Chart area to display collected data - The performance counter data collected by the service will be represented in the chart for the throttling type and the date and time range selected.
5. Zoom and Pan control for better interaction with the chart - The Throttling Analyser chart in BizTalk360 comes with a zoom and pan functionality that helps the user to focus on specific data points within the selected date and time range.
- zoom in - click and drag on the required area
- zoom out - click reset zoom
- pan left/right - right-click or press shift + click and drag chart area to left/right.
6. Timelines to represent data collection - X-axis of the chart represents the date-time values within the date and time range selected to easily coordinate the data points to the instance of time.
7. Throttling data states based on selected throttling type - Y-axis of the chart represents the throttling states of the messages based on the selected throttling types. To know more about Throttling states, please refer to the following articles:
8. Button to Refresh the chart with latest data - The Refresh button will appear for two dates and time range options namely, Today and Last 7 Days as these options have their end boundary sliding relative to time. When the user clicks this button, the latest data is fetched and represented on the chart.
The Throttling Analyser in BizTalk360 has got another section called Filter Graph by BizTalk Hosts and Server Instances, which can be seen as the user scrolls down the page, as shown below
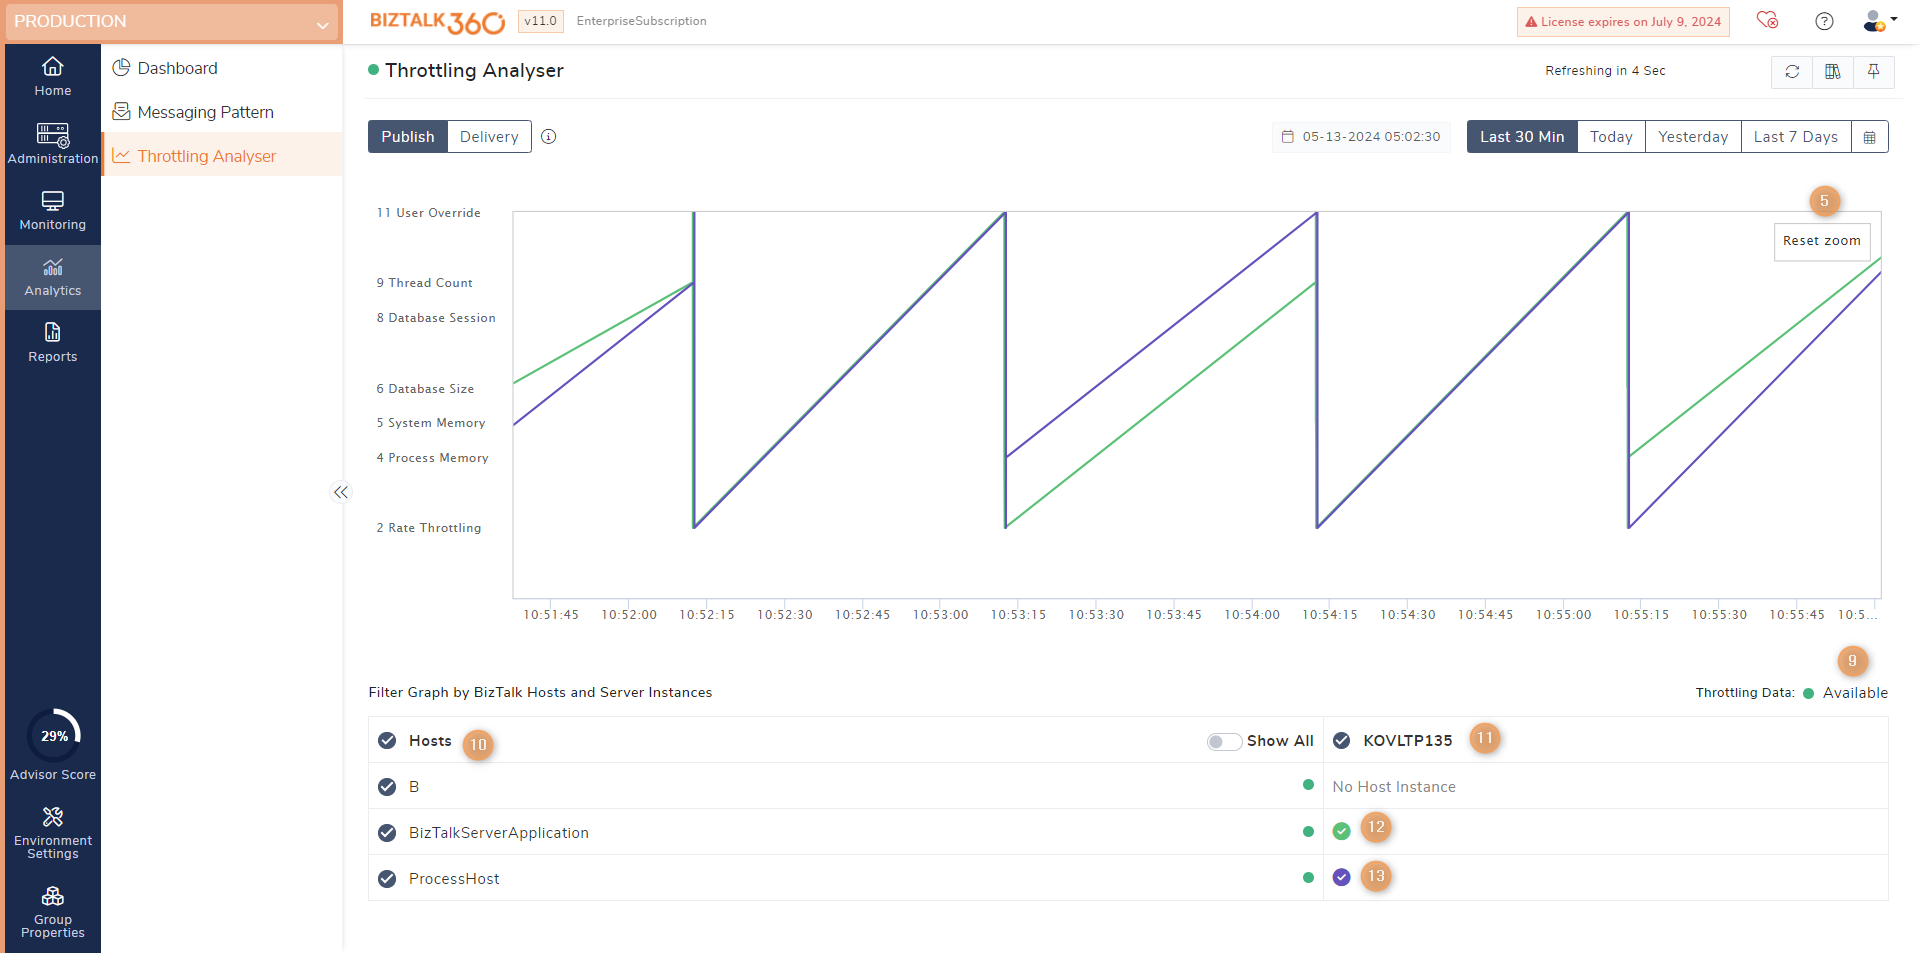
9. Throttling data availability for the selected date and time range - This represents the availability of throttling data in any of the host instances for the selected throttling type and the date and time range. This has two statuses:
- data available - represented in 'green'
- data not available - represented in 'red'
10. List of BizTalk Hosts configured for the environment - This list represents the BizTalk Hosts configured with send or receive handlers for the environment. The 'green' status represents that throttling data is available in any one of the host instances for that host across servers in that environment and 'gray' otherwise. Enable the toggle "show all" to list all the BizTalk hosts configured in the environment.
11. List of Servers - This list represents all the BizTalk servers in the environment. The intersection of the BizTalk Host and Server in this grid corresponds to a BizTalk Host Instance. The 'green' status represents that throttling data is available in any one of the host instances for that server across hosts in that environment and 'gray' otherwise.
12. Throttling data available - If throttling data is available for a host instance for the selected throttling type and the date and time range, it is represented with a tick mark encircled.
13. No host instance - If a server has no instance for a host, it is represented with the text - 'no host instance'.
14. Throttling data not available - If a server has an instance for a host but no throttling data for the selected throttling type and the date and time range, it is represented with a cross mark encircled.
15. Host Instance Error - If a host instance has encountered any error, it will be represented with an associated warning/error image.
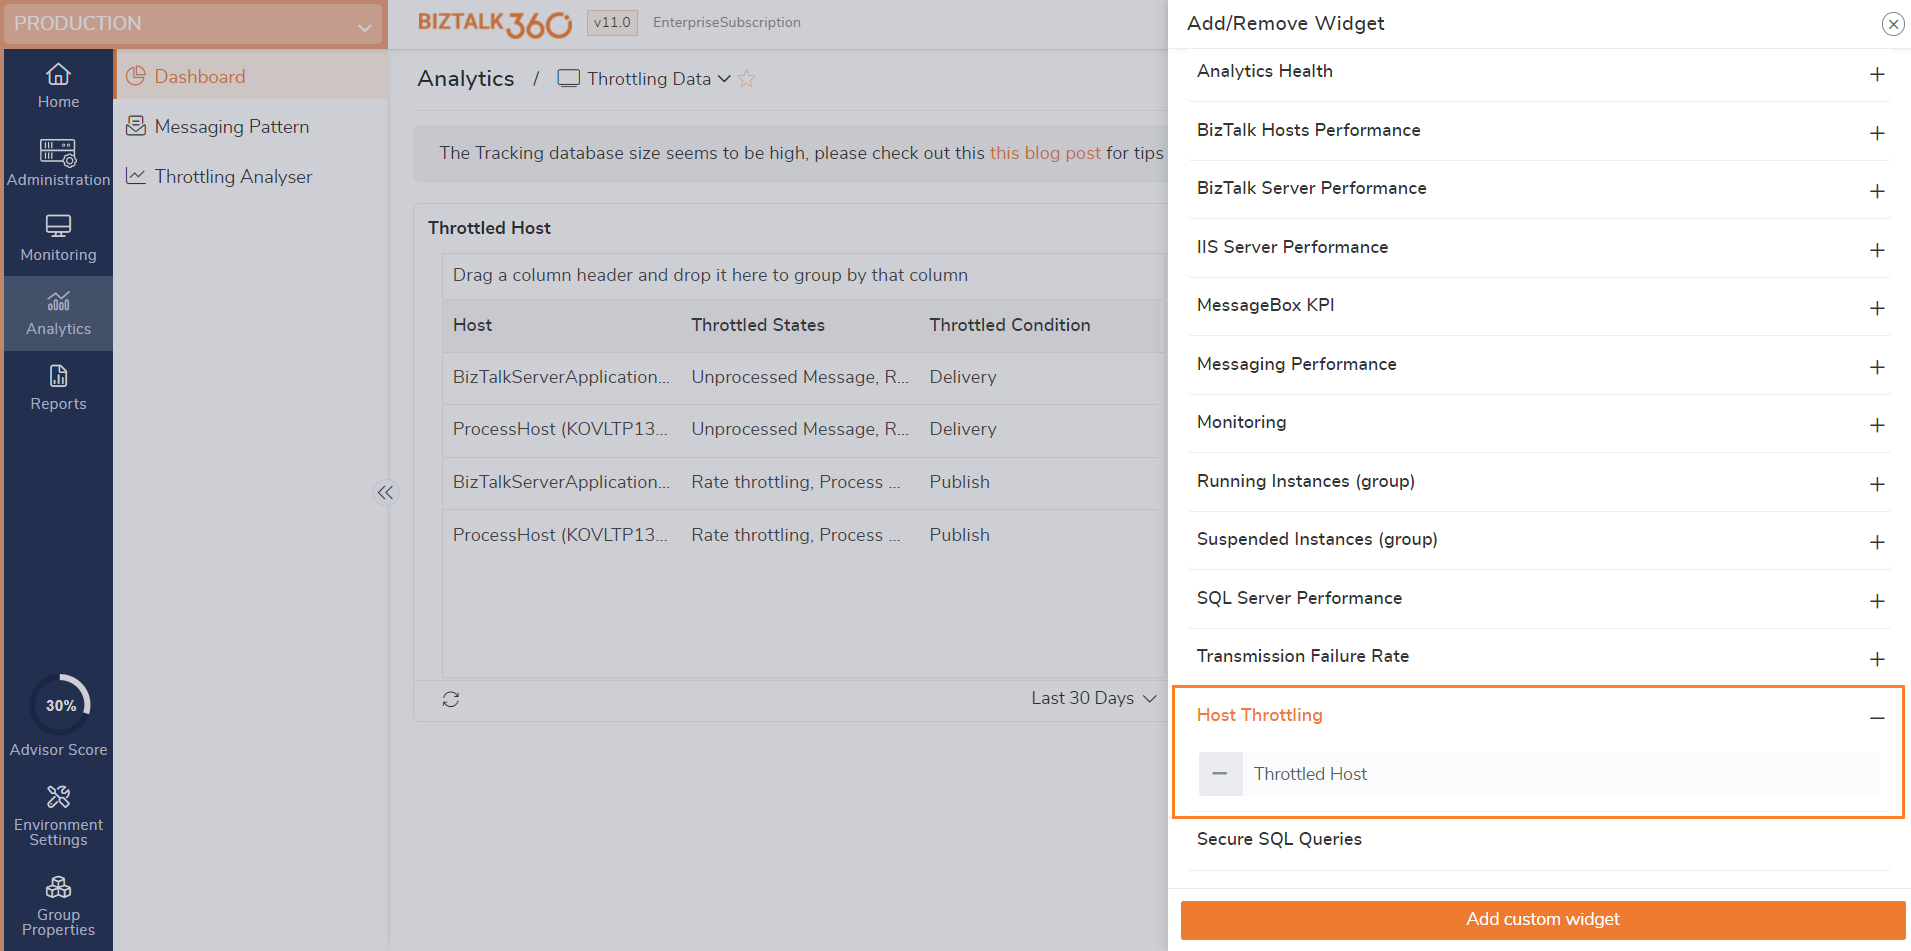
The details of the throttled host will be presented in widgets within the analytics dashboard as well.