Monitoring IBM MQ in a BizTalk environment is crucial for ensuring the reliability, performance, and availability of messaging systems. Which helps administrators identify performance bottlenecks, such as high queue depths or message latency, which can impact the overall performance of BizTalk Server and other connected systems.
Business Use Case
Imagine a large retail company that relies on a warehouse management system integrated with its inventory management and order fulfillment systems. IBM MQ within BizTalk manages communication between the warehouse and external systems, like suppliers and logistics partners, handling critical messages such as inventory updates and shipment details.
- The queues handle crucial messages about stock levels, order confirmations, and shipment status. If queue depths increase beyond normal limits, or if messages are not processed on time, it can cause delays in fulfilling customer orders.
- The listener ensures communication between the IBM MQ queue and BizTalk. It facilitates the processing of incoming messages from other systems. If the listener goes down, messages won’t be picked up for processing, causing a breakdown in the flow of critical information.
- MQ channels transport messages between the queue manager and other systems such as payment , logistics etc . If an MQ channel goes down or gets stuck in a "stopped" or "inactive" state, no messages will flow between systems, resulting in missed communications with vendors and customers.
Monitoring Queues, Listeners, and Channels with BizTalk360 allows administrators to detect issues like queue build-up, listener downtime, or failed channels before they affect operations.
This article explains the process of monitoring IBM MQ entities in BizTalk360
Setting up IBM MQ Monitoring
- Navigate to Monitoring->Manage Mapping->IBM MQ.
- Select the Alarm name (see Manage Alarms) from the drop-down, which you would like to associate the queue for monitoring.
- Click the 'IBM MQ' tab, which list out all the Send Ports/Receive Locations which are using the MQSC adapter or the MQSeries adapter.
- Select the Queue which you want to monitor, which open the configuration blade. The configuration mainly includes Queue Manager configuration and Monitoring Rule Configuration.

It is recommended to use capital letters for the Channel Name in both the MQ Server and BizTalk360.
Before setting up IBM MQ for the monitoring, check necessary permissions are in place
1.Queue Manager Configuration
To Monitor an IBM MQ, the system needs certain information. By following these steps, you can ensure that BizTalk360 has the necessary details to connect and monitor IBM MQ. The Queue Manager configuration can be done in Environment setting .Follow this article to configure Queue Manager.
you can also override the queue manager configuration by enabling override option. The queue configuration requires below details.
- Connection Name - This attribute is the communication connection identifier.
- Channel Name - This option specifies the channel name which is responsible for communicating between two queue managers. IBM MQ uses message channels to transfer messages between queue managers.
- Transport Type - Currently BizTalk360 supports TCP type only.
- Use Service Account Credentials - Enable this check box to use the service account credentials for monitoring IBMMQ provided in system settings. To know how to add service account credentials in settings, follow this article.
- User ID - The name of the user who has the authority to perform any operation on the queue. While creating a user in Computer Management, use a name with less than 8 characters.
- Password - User password
- SSL Cipher Specification - Every MQ Channel definition includes the SSLCIPH attribute. The value is a string with a maximum length of 32 characters. SSL Cipher specification is optionally.
- SSL Peer Name - Peer name specifies the SSL Peer Name used on the channel. The SSL Peer attribute is used to check the Distinguished Name (DN) of the certificate from the peer queue manager or client at the other end of an IBM® WebSphere® MQ channel.

Once the Queue Manager is successfully configured, you will be able to monitor the queues associated with IBM MQ.
2.Monitoring Rule Configurations
This configuration is used for Monitoring the queue metrics.
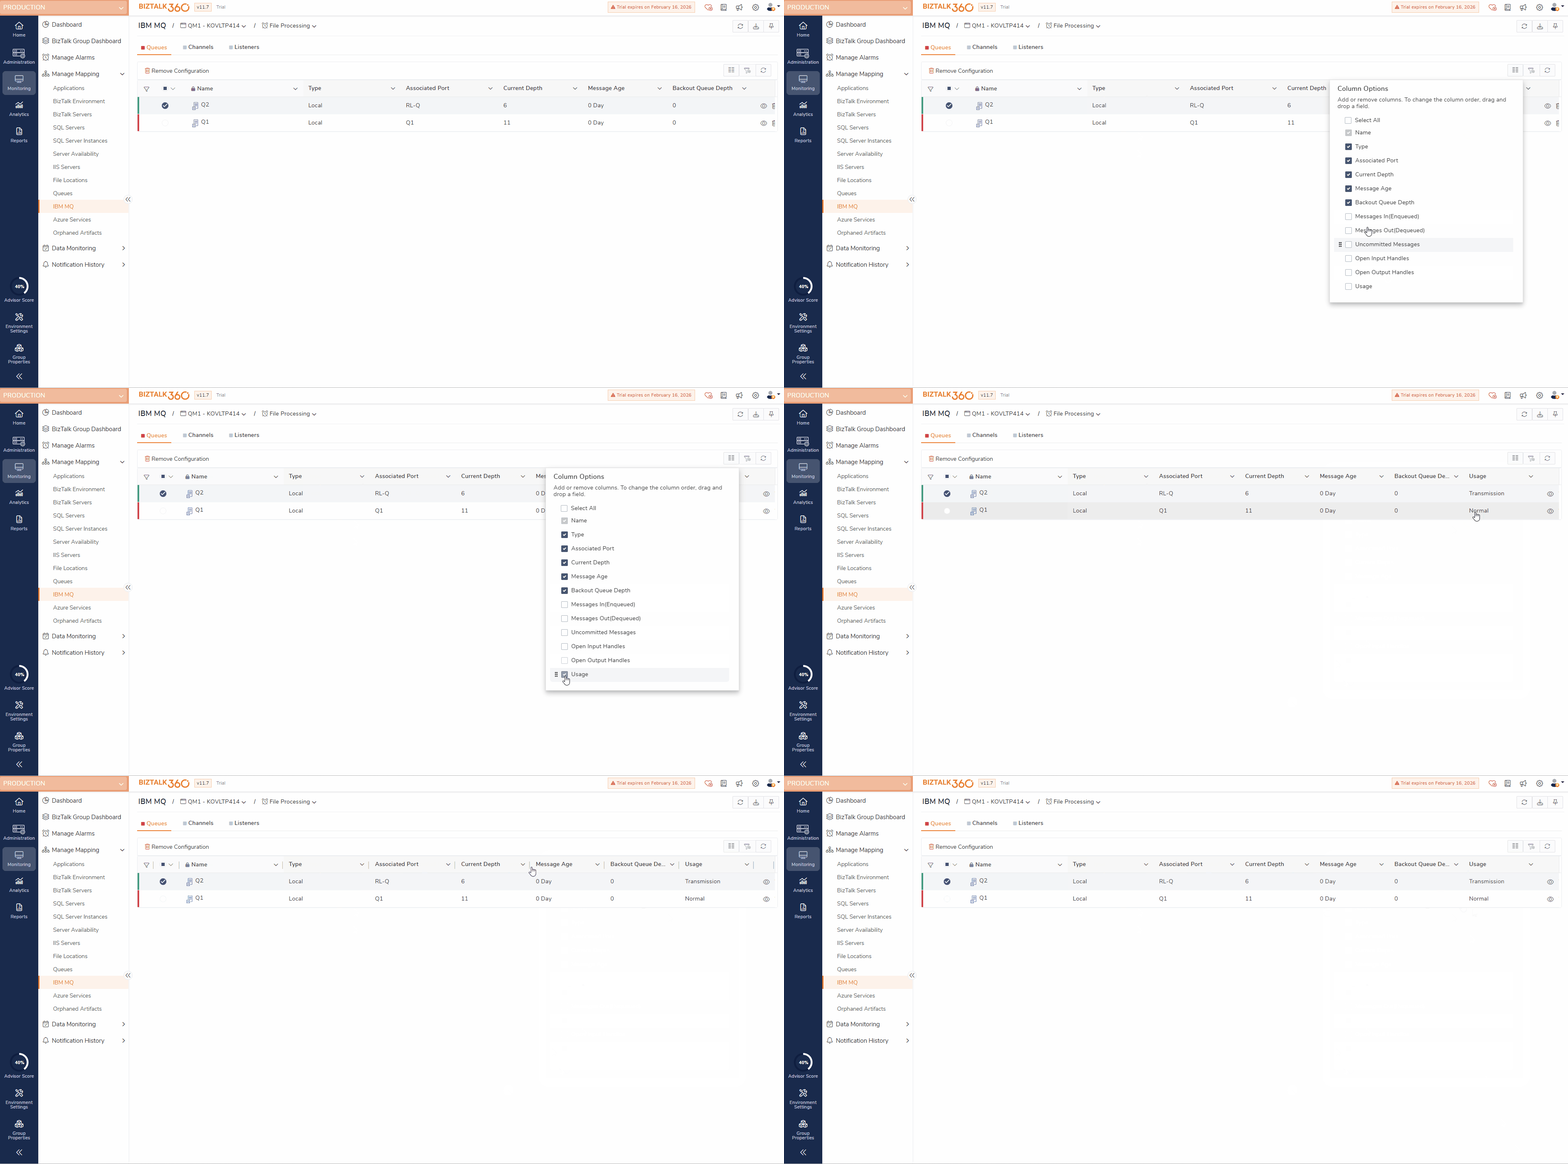
- Message Age Units - This metric configuration allows you to choose the time parameter (Day/Hour/Minutes) for finding the duration of the message that exists in the queue. You can monitor the oldest message in the queue by setting up the Message Age.
- Threshold Monitoring Rules- Queue have below metrics, that can be monitored by configuring the threshold rules.
Current queue depth - Total number of messages in respective queue.
Backout queue depth - Total number of messages in the Backout queue associated with respective primary queue.
Backout queue usage - The percentage of the queue’s current depth relative to its maximum configured depth.
Current queue usage - The percentage of the queue’s current depth relative to its maximum configured depth.
Message age - Indicates the age of message available.
Messages In: Total number of messages enqueued. (60 secs granularity)
Messages Out: Total number of messages dequeued. (60 secs granularity)
Uncommitted Messages: The number of messages that are part of uncommitted transactions. (60 secs granularity)
Open Input Handles: The number of applications that currently have the queue open for reading.
Open Output Handles: The number of applications that currently have the queue open for writing.
Usage - This denotes the type of the queue configures Normal / Transmission.
Save the monitoring configuration by clicking the 'Save' button. The Queue will be added under the IBM MQ tab in Alarms - Queues screen as shown below.
BizTalk360 has the capability to monitor the state of the queue as well as other metrics associated with the queue. The other parameters include Current Queue Depth, Backout queue Depth, Current Queue usage, Backout Queue Usage, and Message Age.

Channel Monitoring
IBM MQ channels are responsible for transferring messages between the systems. These channels may become inactive or stopped state due to configuration errors, network issues, or security misconfigurations. Monitoring helps detect such issues early, preventing prolonged downtime.
For example, in a warehouse fulfilment system, if an MQ channel is down, the system won’t receive inventory updates, leading to delays, stock shortages, and operational disruptions. By monitoring the channels, you can detect such issues early and take action before they impact operations.
To set up monitoring for IBM MQ channels, follow these steps:
- Navigate to Monitoring -> IBM MQ -> Channels->Select Queue Manager. (Refer to the Queue Manager configuration article).
- Under the selected queue manager, you will see a list of available Channels. The channels are listed along with their Name, Type, and Current Status.
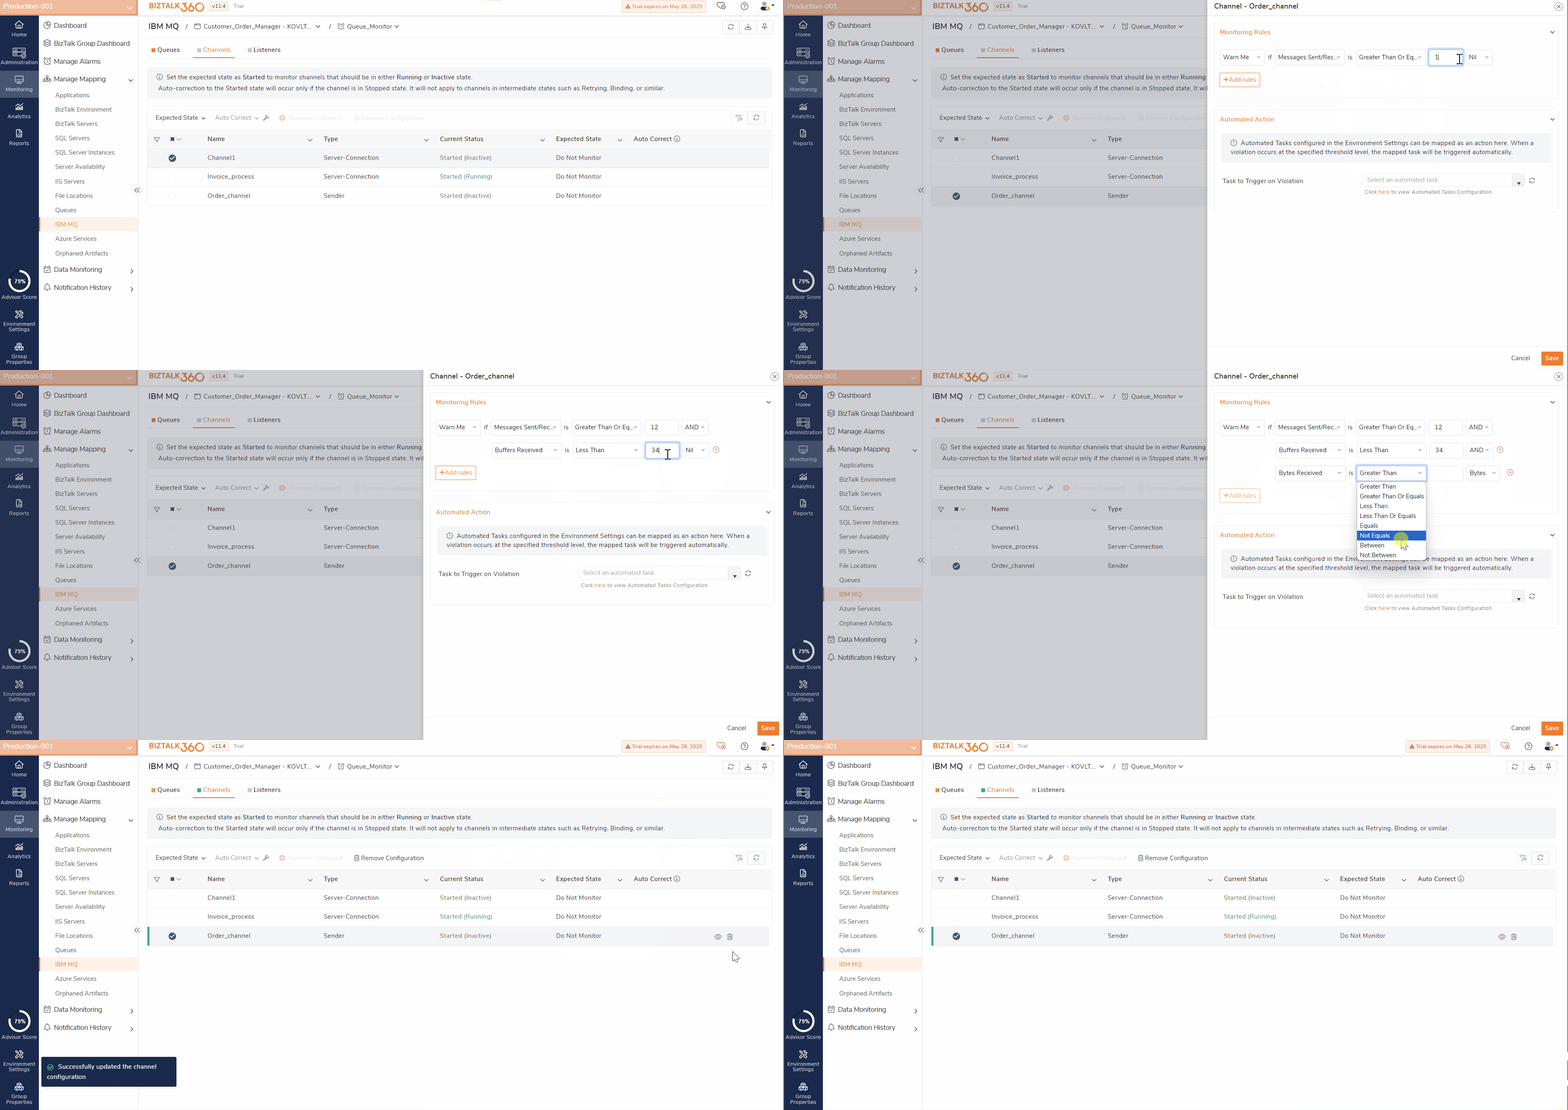
- Select the channel you wish to monitor. Then, set the Expected State as either Started or Stopped.
- If the current state does not match the expected state, the monitoring status will be set as "Critical". For example, if the expected state is "Running" and the listener moves to "Stopped," the monitoring status will be marked as "Critical,". Same will be notified to the user.
- By enabling AutoCorrect, the system can automatically take corrective action when it detects a mismatch between the current and expected state. However, AutoCorrect cannot be configured if the expected state is set to Running, as the system cannot establish a stable connection to ensure the listener stays in the Running state.
- Threshold Monitoring -Monitor the channel metrics such as Messages Sent/Received, Buffers Sent, Bytes Sent
.gif)
Note: The Channel status will be shown as "Started" when it's in "Inactive" or "running".

Listener Monitoring
Monitoring the listener state in a BizTalk environment is crucial because listeners are responsible for processing incoming messages in IBM MQ . If a listener is inactive or stopped, messages cannot be received or processed, leading to delays and disruptions in the overall integration workflow
By monitoring the listener state using BizTalk360, User can Set up alerts to detect when a listener is Stopped or Inactive. Receive notifications if the listener’s state doesn’t match the expected state.Enable AutoCorrect to automatically restart the listener if it stops unexpectedly.
To set up monitoring for IBM MQ channels, follow these steps:
- Navigate to Monitoring -> IBM MQ -> Channels->Select Queue Manager.(Refer to the Queue Manager configuration article).
- Under the selected queue manager, you will see a list of available listeners. The listeners are displayed along with their Name, Protocol ,Port , and Current Status.
- Select the listener you wish to monitor. Then, set the Expected State as either Running, or Stopped.
- If the current state does not match the expected state, the monitoring status will be set as "Critical". For example, if the expected state is "Started" and the listener moves to "Stopped," the monitoring status will be marked as "Critical,". Same will be notified to the user.
- By enabling AutoCorrect, the system can automatically take corrective action when it detects a mismatch between the current and expected state.

Dashboard and Notifications
Once the IBM MQs Queues, Channels and Listeners are mapped for monitoring, the health status will be shown in dashboard in a graphical tree view. If the mapping gets violated, it will be listed in the errors and warnings along with the associated alarms. You can also navigate to the respective IBM MQ on clicking them.

In order to receive email notifications from BizTalk360 on the threshold violation alerts (and auto-correction alerts), you need to configure the SMTP settings under BizTalk360 Settings. Follow the steps in this article to be able to configure the SMTP settings in BizTalk360. You will receive an email notification with the exact details of the status of the Queues.

Use Service Account Credentials for Monitoring
To monitor IBM MQ, users had to give their service account details manually for every single queue. When dealing with lots of IBM queues, user might find difficult to provide account details for each one by hand. It would be easier if the system could automatically grab these details from somewhere. So, we have added an option in system settings where users can enter their credentials.
Navigate to Settings->System Settings->Global Configurations-> update service account credentials, these details will be used for queue communication.
Then, in the IBMMQ configuration, there's a check box "Use Service Account Credentials" added. By enabling this check box, the system will automatically use the credentials updated in the settings. If users prefer to provide the credentials manually, they can still type in the credentials without enabling the check the box.
For detailed information on the giving the necessary permissions, feel free to refer to the document: IBM MQ - Permissions

Common IBM MQ Connection Errors and What to Do About Them?
In a multi-Server setup, users may encounter errors when configuring BizTalk360 to monitor IBM MQ queues from a different server. Consequently, the queue becomes orphaned and generates an error code indicating the reason for the connection failure. User can view the error code by hovering over the warning icon near the Port name.

For detailed information on Troubleshooting IBM MQ cases, refer to the document: IBM MQ - Troubleshooting