What is the purpose of Logic app Data Monitoring?
Microsoft's approach to hybrid integration with BizTalk Server and Logic Apps indeed addresses the modern enterprise IT landscape effectively. By combining the strengths of on-premises and cloud-based solutions, organizations can seamlessly integrate their diverse systems and data sources.
By combining BizTalk Server and Logic Apps within Microsoft's Hybrid Integration Platform, organizations can enjoy the best of both worlds: the stability and control of on-premises integration with BizTalk Server, and the agility and scalability of cloud integration with Logic Apps. This hybrid approach enables businesses to adapt to evolving IT landscapes, leverage existing investments in on-premises infrastructure, and take advantage of the innovation and scalability offered by the cloud.
Hence, monitoring the metrics of logic apps plays an important role in managing such business environments. Logic apps data monitoring feature in BizTalk360 helps in meeting this requirement.
Setting up Logic Apps Data Monitor
Follow the steps as shown below to create a Logic Apps Data Monitoring alarm:
- Follow the steps as mentioned in this section to create a Data Monitoring alarm.
- Select the Use this alarm for Data Monitor Alerts check box to map the current alarm to Data Monitors. Only when this option is selected, the Notify on Success as well checkbox gets activated.
- The 'Notify on Success as well' check box is optional for Data Monitoring, while the Use this alarm for Data Monitor Alerts option is mandatory.
- Click OK to save the alarm information.
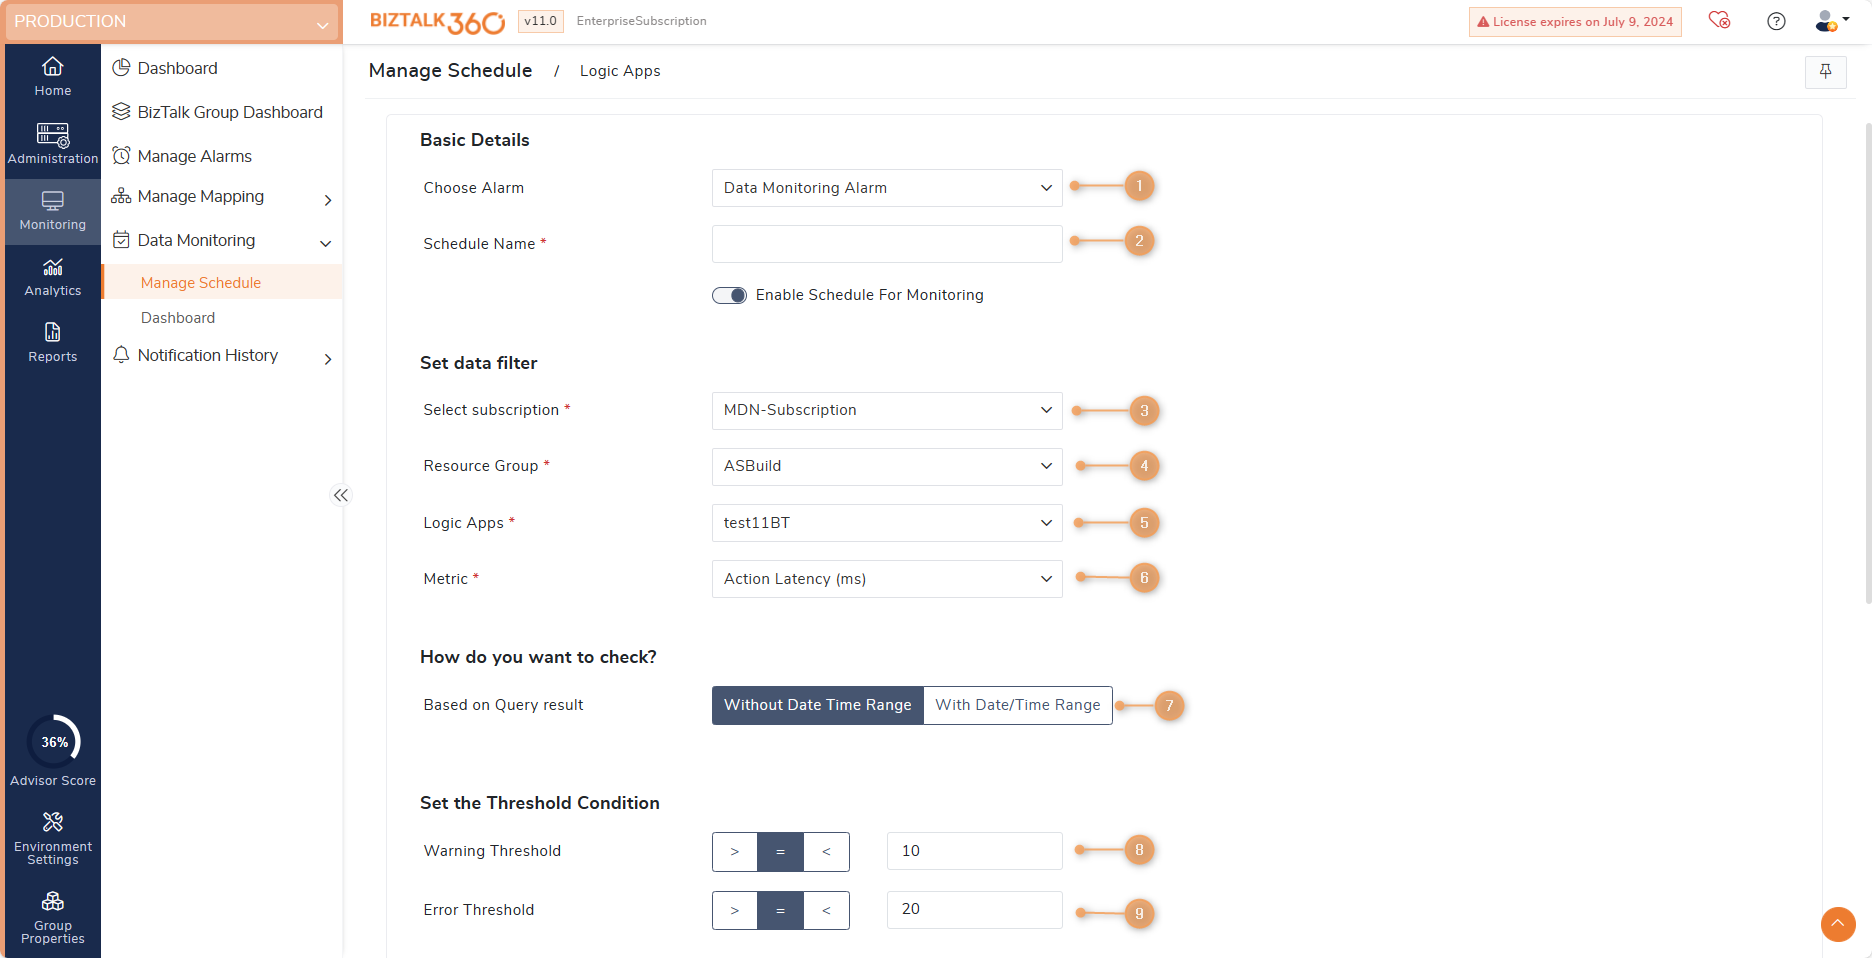
- Choose Alarm - As mentioned above, the first step is to set up Logic Apps data monitoring is to create an alarm. Once you have created the alarm, the alarm name will be displayed in the dropdown. Select the alarm that should be used for Logic Apps data monitoring purposes.
- Friendly Monitor Name – A meaningful name for Logic Apps Data Monitor. Say, as per your requirement you want to get notified with a warning message when the number of Billable Executions is greater than 25 in specific Logic App and throw an error message when the number of Billable Executions is 50. The monitor can be set as “Latency Monitor in LogicApps LogicAppName > 25, trigger warning;> 50, trigger error.”
- Azure Subscription – Select the subscription name from the list of Azure subscription that has been configured for the environment in the settings section.
- Resource Group – Select the Resource Group which contains the Logic App you want to monitor, from the list of Resource Groups which are available in the selected subscription.
- Logic App – Select the Logic App that you want to monitor from the list of Logic Apps that are available in the selected subscription.
- Metric – Select metric that you want to monitor from this dropdown
- How do you want to check?
- Based on only Query result count (no date/time filter) – Selecting this option will execute the query without applying any date time filter. i.e. All the data will consider for query execution.
- Based on query result with date/time range – Selecting this option will apply the Timestamp filter for query execution. (The values configured for setting trigger time, Set Monitoring Times ->At What Time, will be used for Timestamp filter). Say, for instance, if the data monitor is scheduled to execute every hour from 9 AM to 6 PM, and currently the time is 11:59 AM, during the next run of the data monitor at 12 PM, it will look for the query results between 11:01 AM and 11:59 AM and generate the results.
- Warning Threshold – Select the value from the drop-down on when you want to be notified when there is a warning. The first drop down is to select the Operator (>, <, =), and the second operator is to select the warning value. For e.g. When Billable Action Executions > 25, throw a warning.
- Error Threshold – Select the value from the drop-down on when you want to be notified where there is an error. The first drop down is to select the operator (>, <, =) and the second operator is to select the warning value. For e.g. when Billable Action Executions > 50, throw an error.
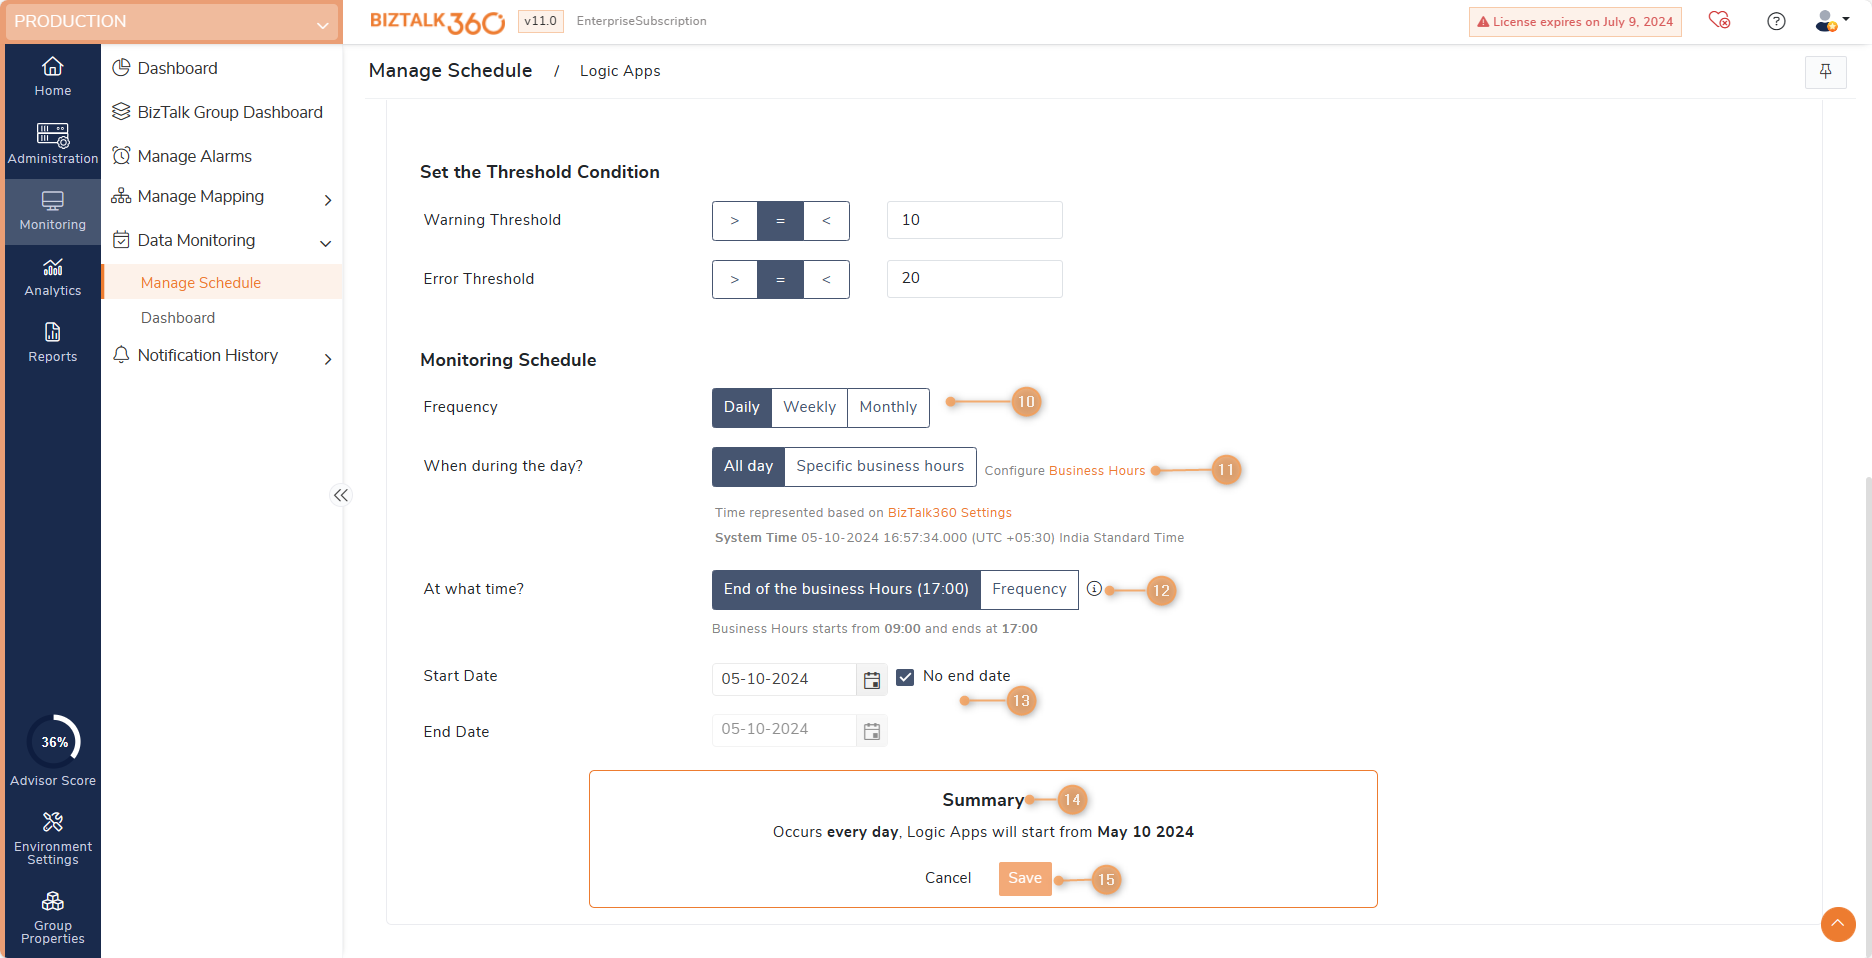
Note: For the metrics related to Latency the unit of the Error/Warning threshold will be time (ms). So Run Latency > 25 means Run Latency > 25 milliseconds - How often you want to monitor– Select the duration of how often you want to monitor for Logic Apps metrics. The options are Daily, Weekly and Monthly. Depending on the selection, you can add further filter criteria on how often you want to monitor.
- Daily – Will set up the data monitor to execute daily.
- Weekly – The data monitor will execute on the selected days of the week (Every day, Monday-Friday, or the selected day of choice). To add a single day of the week, click the control and select the day of your choice.
- Monthly – The data monitor will execute on the selected day of the month. To add a specific day of the month, enter the date in the space provided or select the date from the dropdown.NoteIf a day is not present in the month (say, 29th Feb), then the system will skip that month and generate the results on the specified day in the month. The monthly Data Monitoring schedule configuration now includes an additional option called "End-of-Month." By selecting this option, the schedule will be executed at the end of the month, considering the complete month's data for monitoring purposes.
- When during a day – Select the time when the data monitor must execute on a day during business hours. You can customize your business hours by selecting the values from the Business Day Start and Business Day End option
Note: By default, the business day start time is 9 AM and the business day end time is 5 PM. - At what time– Select the time when the data monitor should execute on a day. The options are – At the end of the business day and at a set frequency (every 1 hour or 15 minutes)
- At the end of the business day– If this option is chosen, the data monitor will execute depending on the value chosen in the Business Day End field. For e.g. if the business end time specified is 5 PM (default value), the data monitor will execute exactly at 5 PM
- Monitor every X minutes/hours– You can define specific intervals during the business hours when the data monitor should execute. The options available are Minutes and Hours
- Minutes – Select the number of minutes after which the data monitor should execute. E.g. 2 hours means the data monitor will execute once in every 30 minutes. The minimum time interval supported is 15 minutes, which means the data monitor will execute 4 times (15 minutes x 4 = 60 minutes) in an hour.
- Hours – Select the number of hours after which the data monitor should execute during the business hours. E.g. 2 hours means the data monitor will execute once in 2 hours between 9 AM and 5 PM. The minimum time interval supported is 1 hour.
- Monitor every X minutes/hours– You can define specific intervals during the business hours when the data monitor should execute. The options available are Minutes and Hours
- At the end of the business day– If this option is chosen, the data monitor will execute depending on the value chosen in the Business Day End field. For e.g. if the business end time specified is 5 PM (default value), the data monitor will execute exactly at 5 PM
- Advanced – This section can be used to define advanced settings for data monitoring. You can define a date range (from the date and to date) when you want the data monitor to execute. You can set up a data monitor to start, say on a Monday, and end on the next Thursday. In addition to this, you can set up the settings mentioned above in the previous steps. This means the data monitor will only start to run next Monday and will not execute after Tuesday.By default, the advanced section will be in a collapsed state. Click the ‘>’ button to expand the advanced section and make the settings.
- Summary – The summary information will automatically be populated based on the information selected in the previous columns.
- Save – Once all the values are selected in the previous steps. Click Save to save the settings.
Logic Apps Schedule Execution Results
Once the schedules are created, it will get executed on the specified time frame. Once after the execution of schedules, it will be displayed in the data monitoring dashboard. You can go to the data monitoring dashboard and click on the respective schedule to view the data monitoring schedule execution results.
Once the Logic app Data Monitor is created and configured, it will execute during the specified time intervals. The Data Monitoring dashboard will display the status of the Logic app Data monitor on a specific date at a specific time interval in the calendar chart control.
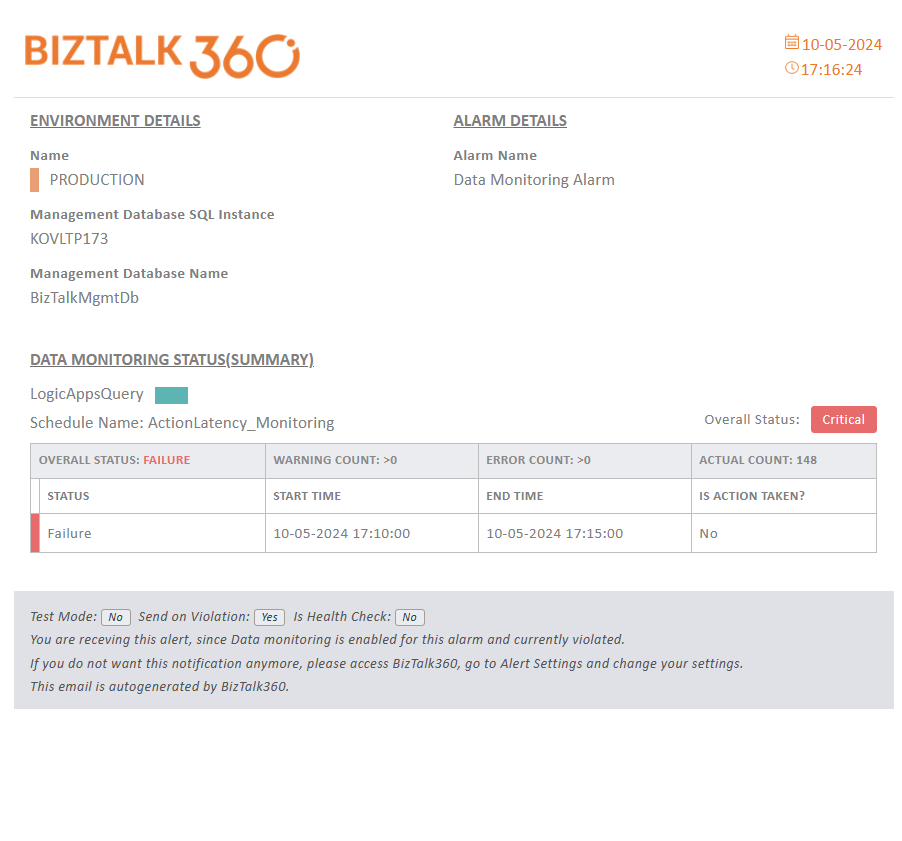
Based upon how you configured your Data Monitoring alarm, emails might get triggered to the email id(s) which are specified while creating that Data Monitoring alarm.
The email alert(s) will contain the Logic app Data Monitor Execution Results of the data monitor. By default, if you only selected the 'Use this alarm for Process Monitor Alerts' option, you will only receive the Failure emails to the configured email address(es). Alternatively, if you also selected the 'Notify on Success as well' option, you will receive the success alert emails as well to your mailbox. The following screenshot depicts a successful email notification received for a configured Logic app Data monitor.