Scheduled reporting in BizTalk360 enables users to easily obtain configured dashboards or Secure SQL queries in PDF/Excel format at regular intervals per the schedule settings. This functionality empowers companies to proactively monitor, assess, and refine their BizTalk environment, guaranteeing smooth integration operations.
Types of Reports
Analytics Dashboard
The Analytics Dashboard feature in BizTalk360 allows the team to create customizable dashboards comprising widgets that monitor performance metrics related to BizTalk, SQL, IIS, and Windows environments. For example, users can add message processing rates, database performance, and system resource utilization as a widget in the dashboard. This can be mapped to the schedule to receive periodic updates about the configured performance widgets.
Administration Dashboard
The Administration Dashboard allows users to create fully customizable dashboards using widgets that monitor BizTalk artifacts and their associated data. Users can configure widgets to display key metrics such as the count of service instances by state, environment artifact counts, and host instance status, providing a consolidated operational view. These dashboards can also be mapped to scheduled reports, allowing users to receive regular updates on the configured widgets, ensuring continuous visibility into the health and performance of the BizTalk environment.
Application Dashboard
Through the Application Dashboard, the admin can generate reports that provide insights into the health of each application. These reports can include metrics such as the number of service instances, the status of applications, and the monitoring status of associated artifacts. By regularly reviewing these reports, the admin can quickly identify any issues that may arise within the applications.
ESB Dashboard
The ESB Dashboard provides a comprehensive view of ESB Exception Management by presenting key metrics such as fault counts categorized by application, fault codes, and services. It enables users to gain deeper insights into message handling by allowing them to configure and schedule reports associated with dashboards.
Assume a scenario where an organization wants to track messages that are resubmitted on a weekly basis. In such case, users can configure an ESB dashboard by adding widgets Resubmission over Time by Service , and Resubmission over Time by Application to analyze data based on applications. Then this ESB Dashboard can be associated to a reporting schedule and receive periodic updates, which allows the organization to track the resubmissions automatically on a weekly basis.
EDI Dashboard
The EDI Dashboard displays key metrics related to Electronic Data Interchange (EDI) processes, such as interchange and transaction counts by partner, agreement, and encoding.
Users can configure the reporting schedule to receive periodic updates on EDI performance.
Example Scenario: A financial services company required to submit monthly audit reports on all electronic data exchanges for compliance can:
Create a custom widget that retrieves EDI and AS2 transmission data. Map the dashboard to a monthly reporting schedule.
This configuration ensures the compliance team automatically receives summarized reports on EDI and AS2 transmission statuses (Success, Pending, Failed), reducing manual effort and ensuring audit readiness.
.gif)
BAM Dashboard
The BAM Dashboard provides a real-time, interactive view of Business Activity Monitoring (BAM) data.
Users can select specific BAM Views and Activities, along with related activities, to visualize data within a defined date-time range.
These dashboards can be mapped to a report schedule to receive regular updates automatically.
Example Scenario: To track Inbound Order Activities weekly, users can:
- Create a widget by selecting the relevant BAM View and InboundOrderActivity.
- Enable the “Show Related Activities” option to include associated processes.
- Filter data and link the dashboard to a weekly schedule.
This setup ensures weekly automated reports are generated, providing complete visibility into order processing activities.
 Secure SQL Query
The Secure SQL Queries feature within BizTalk360 provides a robust platform for storing predefined queries securely and granting access to BizTalk members for executing queries. BizTalk360 comes with a default set of preloaded queries, and users with the right permissions can create custom SQL queries to fit their requirements. These queries can be associated with reports, this allows users to receive notifications based on report schedules in the excel about the results of the mapped queries.
Users also have the ability to include multiple SQL queries within a single report and retrieve the results all at once. Users can add up to 5 queries in a single report. This feature streamlines the process, allowing users to generate a comprehensive report that combines the outputs of several queries without the need to execute them individually.
.gif)
Follow this article for more information.
Create New Report
To initiate reporting in BizTalk360, the first step is to create Reporting Schedules, which allow configuring the timing for report generation.
Follow below steps to create new report.
1. Log in to BizTalk360.
2. Navigate to Reports -> Manage Reports, then click on "New Report".
3. In the Report configuration blade, provide Report Name and Description.
4. Choose the Report Type:
- Administration Dashboard: Map globally configured Administration dashboards to include performance metric details in the report.
- Analytics Dashboard: Map globally configured Analytics dashboards to include performance metric details in the report.
- Application Dashboard: Map globally configured Application dashboards to provide insight into application status.
- BAM: Map the globally configured BAM dashboards to include the BAM and its related activity details in the report.
- ESB: Map the globally configured ESB dashboards to include the ESB exception management details in the report.
- EDI: Map the globally configured EDI dashboards to include the EDI and its partner insights in the report.
- Secure SQL Query: Map query configured in Secure SQL Query. User can map multiple queries to same report to get all the query result in single email.
5. Disable report: During the maintenance or when you are in progress of report modification you can disable the report, prevent unnecessary data generation.
6. Reporting Schedule: Choose from options like daily, weekly, or monthly and set the schedule time, e.g., daily at 9 AM or on the 15th of every month at 6 PM.
When you select 'Monthly', You can create the schedule for a particular day in the month. Example: 17th of every month at 11 AM.
If a particular day is not present in the month (say, Feb 29), then the BizTalk360 Reporting service will skip that month and no report will be generated for that month.
7. Archive Location: Enable to save reports as PDF in a configured path. Configure the archive location path in system settings under Global Configuration.
8. Configure Notification settings (Email and Notification channels Teams, Service Now, Slack etc.) to specify where the report should be sent. Users can customize the email subject according to their preferences. For detailed instructions, refer to this article.
9. Click "Save" to save the report configuration. Once the schedule is configured, in manage report section, you can see the next run time when the schedule will become generated next.
Manage Report
- In the Manage Report section, all configured reports will be displayed, including the Report name, Schedule frequency, Status, and Next Run Time.
- Users have the option to Enable/Disable or Delete reports directly from this section.
- To modify report configurations, simply click on the report to open the configuration window and make necessary changes.
.png)
Import/Export Reporting Configuration
Let's consider a scenario where organizations need to replicate their configurations across different environments. It is obviously a difficult task to create multiple reports of same configurations in various environments. The Import/Export feature in BizTalk360 helps to overcome this situation. We can export and Import the Report from development to the production environment. This reduces the effort of users creating similar reports in different environments.
Importing Report with Application Dashboard:
The reports configured with the application dashboard will get imported if only the respective application exists in the destination environment. If the application isn't available, then importing those reports will be failed.
Importing Report with Administration, Analytics, ESB, BAM and EDI Dashboard:
When importing a Administration/Analytics/BAM/ESB/EDI Report into an environment, BizTalk360 checks whether the associated Dashboard already exists in the destination environment.
- If the same Dashboard is available, the report will be imported and mapped to the existing dashboard.
- If the Dashboard is not available, BizTalk360 automatically import and create the required Dashboard along with the report.
Assume that a user wants to import a report named “BAM_Inbound_Order_Report” into a target environment. This report is linked to a BAM Dashboard called “Inbound_Order.” In the destination environment "UAT", there are no existing BAM Dashboards configured. During the import process, BizTalk360 identifies that the “Inbound_Order” dashboard configured in the report is missing and it automatically imports both the report and its associated dashboard to ensure that the report can function correctly without requiring any manual intervention.
Importing report with SQL Query
While importing a report with SQL Query, the report will get imported if the same query is available in the destination environment.
Assume that user is trying to import a report which is configured with a SQL Query named "Disabled Artifacts" and that query is not available in the destination environment. In such case, the report will get imported in the destination environment. But there will be no query selected within the report configuration. And a note will be shown stating "Previously mapped SQL Query has been deleted, remap this report with other SQL query".
Orphaned Reports
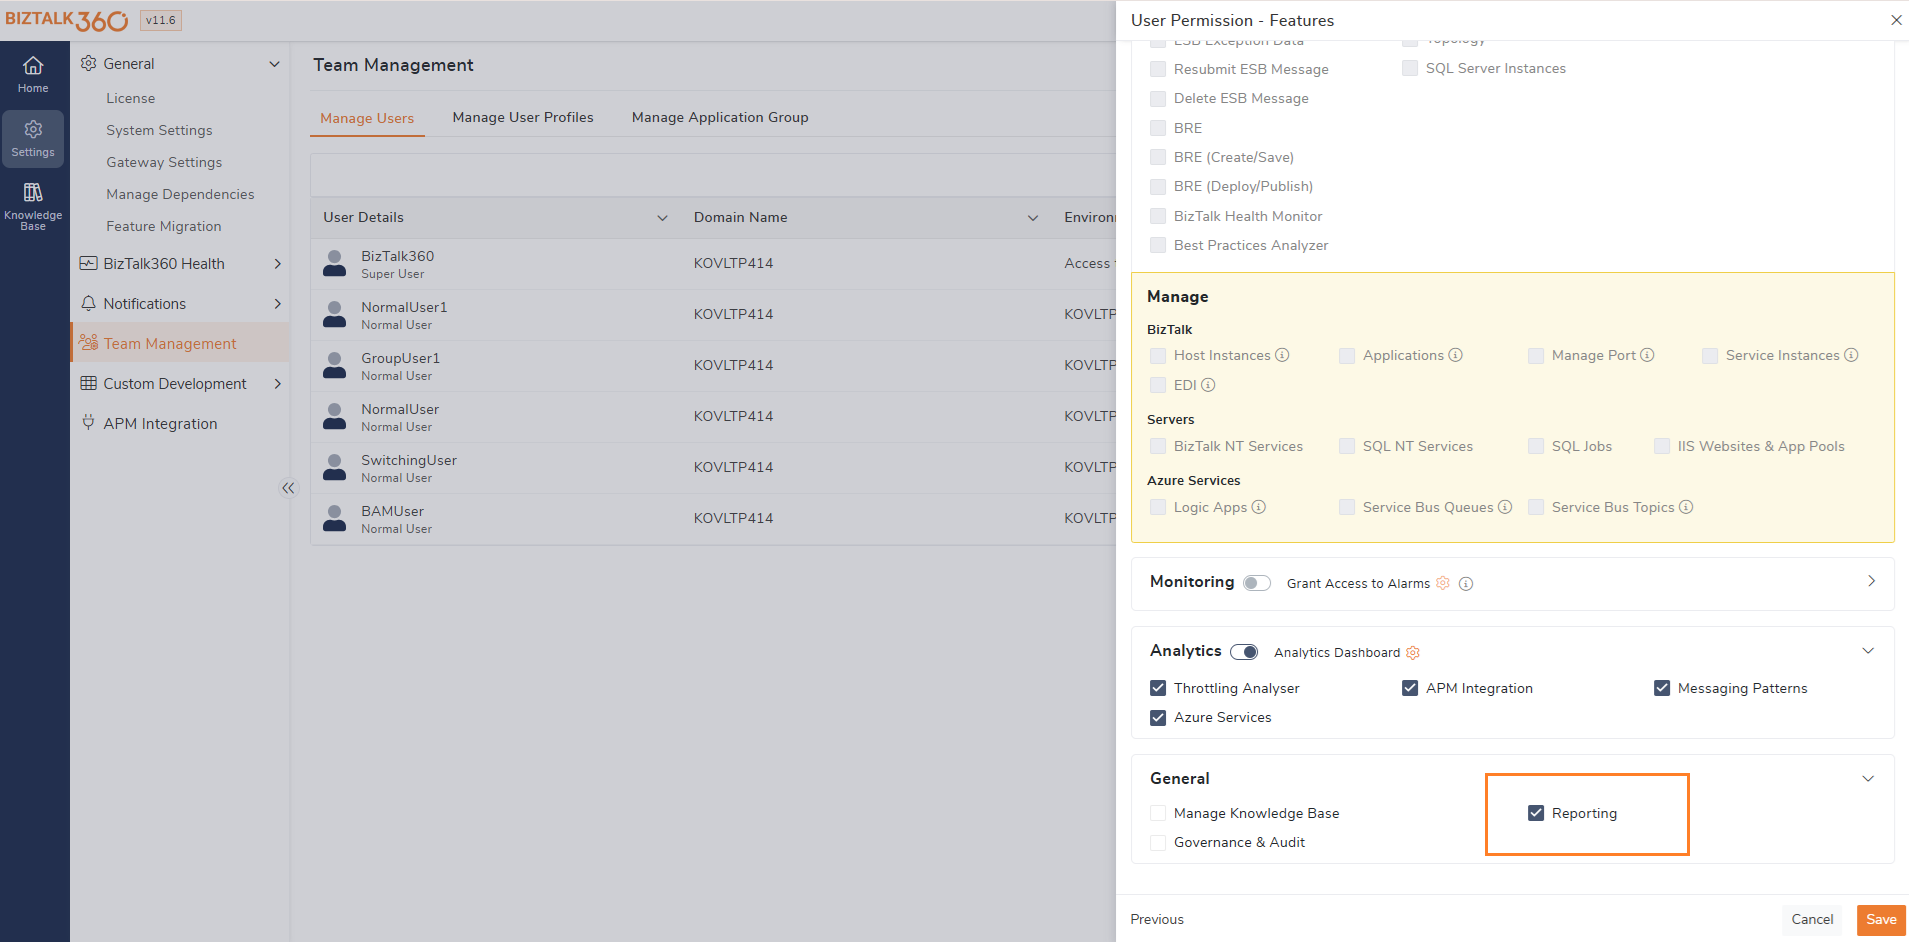
User Access Policy
- Within the access policy, users who has permissions for specific applications can generate reports configured with those applications and receive reports of it on a scheduled basis.
- For receiving reports containing Administration dashboards, users need access to the respective dashboard. These access requirements ensure that users can create and receive reports based on the permissions available for them.
- Similarly, for receiving reports containing Analytics dashboards, users need access to the respective dashboard. These access requirements ensure that users can create and receive reports based on the permissions available for them.
- For reports based on SQL Queries, users must have access to Secure SQL Query and appropriate permissions for executing SQL queries to generate the report.
- For BAM report type, the user must have access to the respective BAM Dashboard. Based on the access provided for the particular user, they can configure reports for BAM.
- For ESB report type, the user must have access to the respective ESB Dashboard. Based on the access provided for the particular user, they can configure reports for ESB.
- For EDI report type, the user must have access to the respective EDI Dashboard. Based on the access provided for the particular user, they can configure reports for EDI.
Licensing
The report generation is subjected to license privileges.
- Bronze & Silver license: Users can generate report for application and administration dashboard.
- Gold license: Users can generate report for Application Dashboard, Secure SQL Query, ESB and BAM Dashboard.
- Platinum license: Users can generate report for Analytics Dashboard, Application Dashboard, Secure SQL query, ESB, BAM and EDI Dashboard.