New Relic is widely used by companies as an enterprise-wide monitoring solution. New Relic has the capability to provide deep performance analytics of your configured environment. It is easy to analyse the data and get insights in real-time. BizTalk360 brings integration with New Relic. If you are already using New Relic, you can view the performance metrics of the BizTalk server environment across multiple dashboards within New Relic.
This section describes the integration with New Relic, which is divided in the following parts:
- How does BizTalk360 connect with New Relic
- How to configure BizTalk360 with New Relic
- Viewing the BizTalk360 Analytics Data in New Relic
How does BizTalk360 connect with New Relic
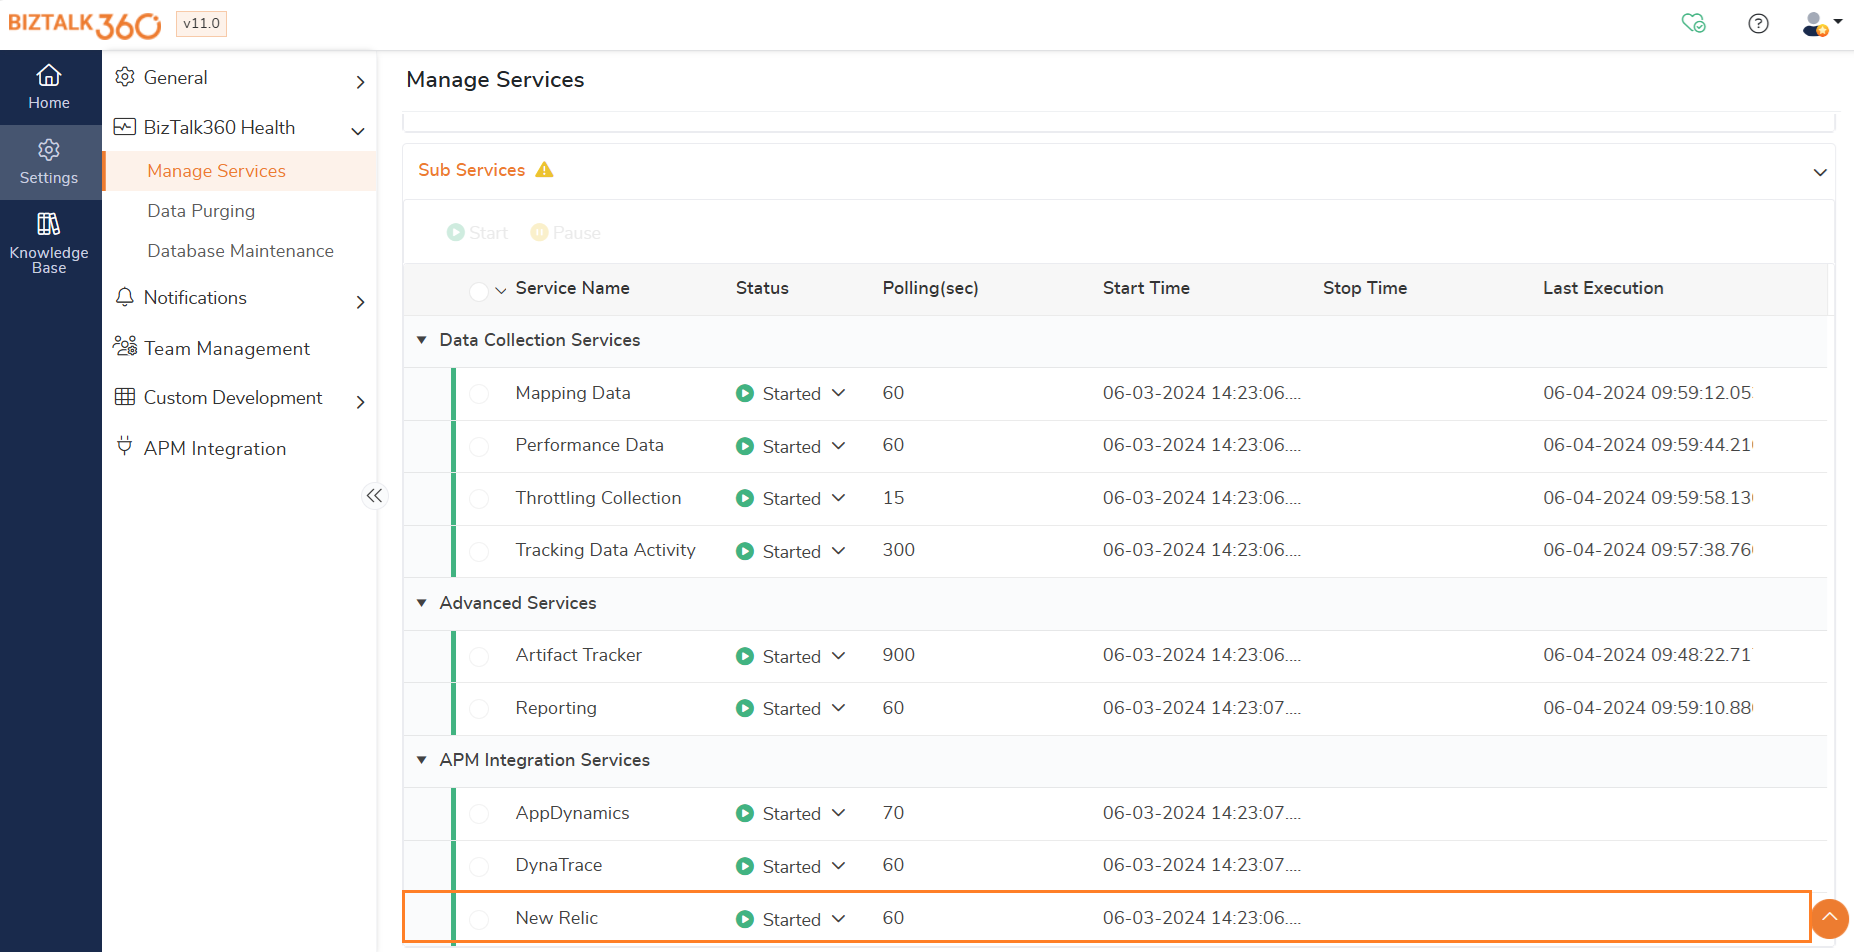
The BizTalk360 Analytics service includes a sub-service called "New Relic", which is responsible for pushing the analytics data from BizTalk360 to New Relic. The New Relic sub service executes every 60 seconds and checks for data in the Performance Data service (another BizTalk360 analytics sub service). Any new data will be immediately pushed by the New Relic sub service in BizTalk360 to New Relic (SDK). Please note that analytics should be enabled for the environment (even though you have configured New Relic). Only then, New Relic service will push the data to the platform.
By default, when you install/upgrade BizTalk360, the New Relic sub service (under Analytics Services) will be in the Paused state. You need to manually start this service by following this path - (BizTalk360 -> Settings -> BizTalk360 Health -> Analytics Services -> New Relic), after adding the New Relic license key. This is an important step. Without performing this step, you will not be able to view the BizTalk360 analytics data in New Relic.
How to configure BizTalk360 with New Relic
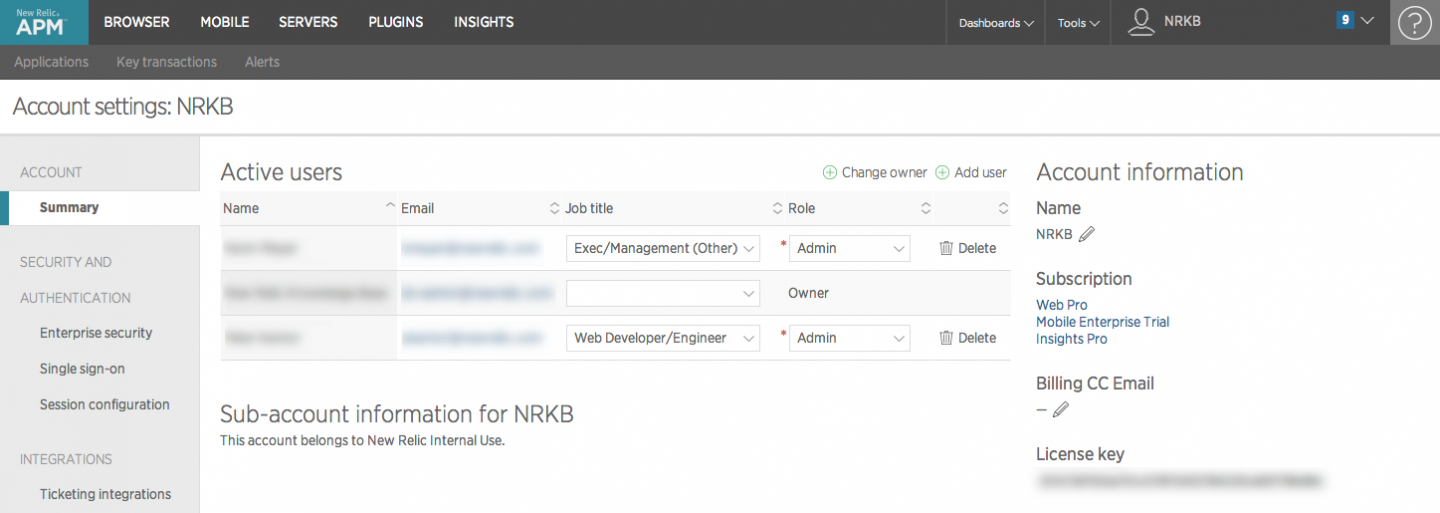
You must configure BizTalk360 to work with New Relic by adding the New Relic license key in the BizTalk360 Settings. The License key is a 40-character hexadecimal string that is provided by New Relic when you sign up for an account. To get the New Relic license key, follow the steps as shown below:
- Log into your New Relic account
- Select your Account Name (at the top right corner) > Account Settings
- Copy the license key from the Account Information section
Adding the New Relic key to BizTalk360
Once you have retrieved the license key from New Relic, follow the steps as shown below to configure New Relic with BizTalk360:
Navigate to BizTalk360 -> Settings > APM Integration > New Relic Configuration.
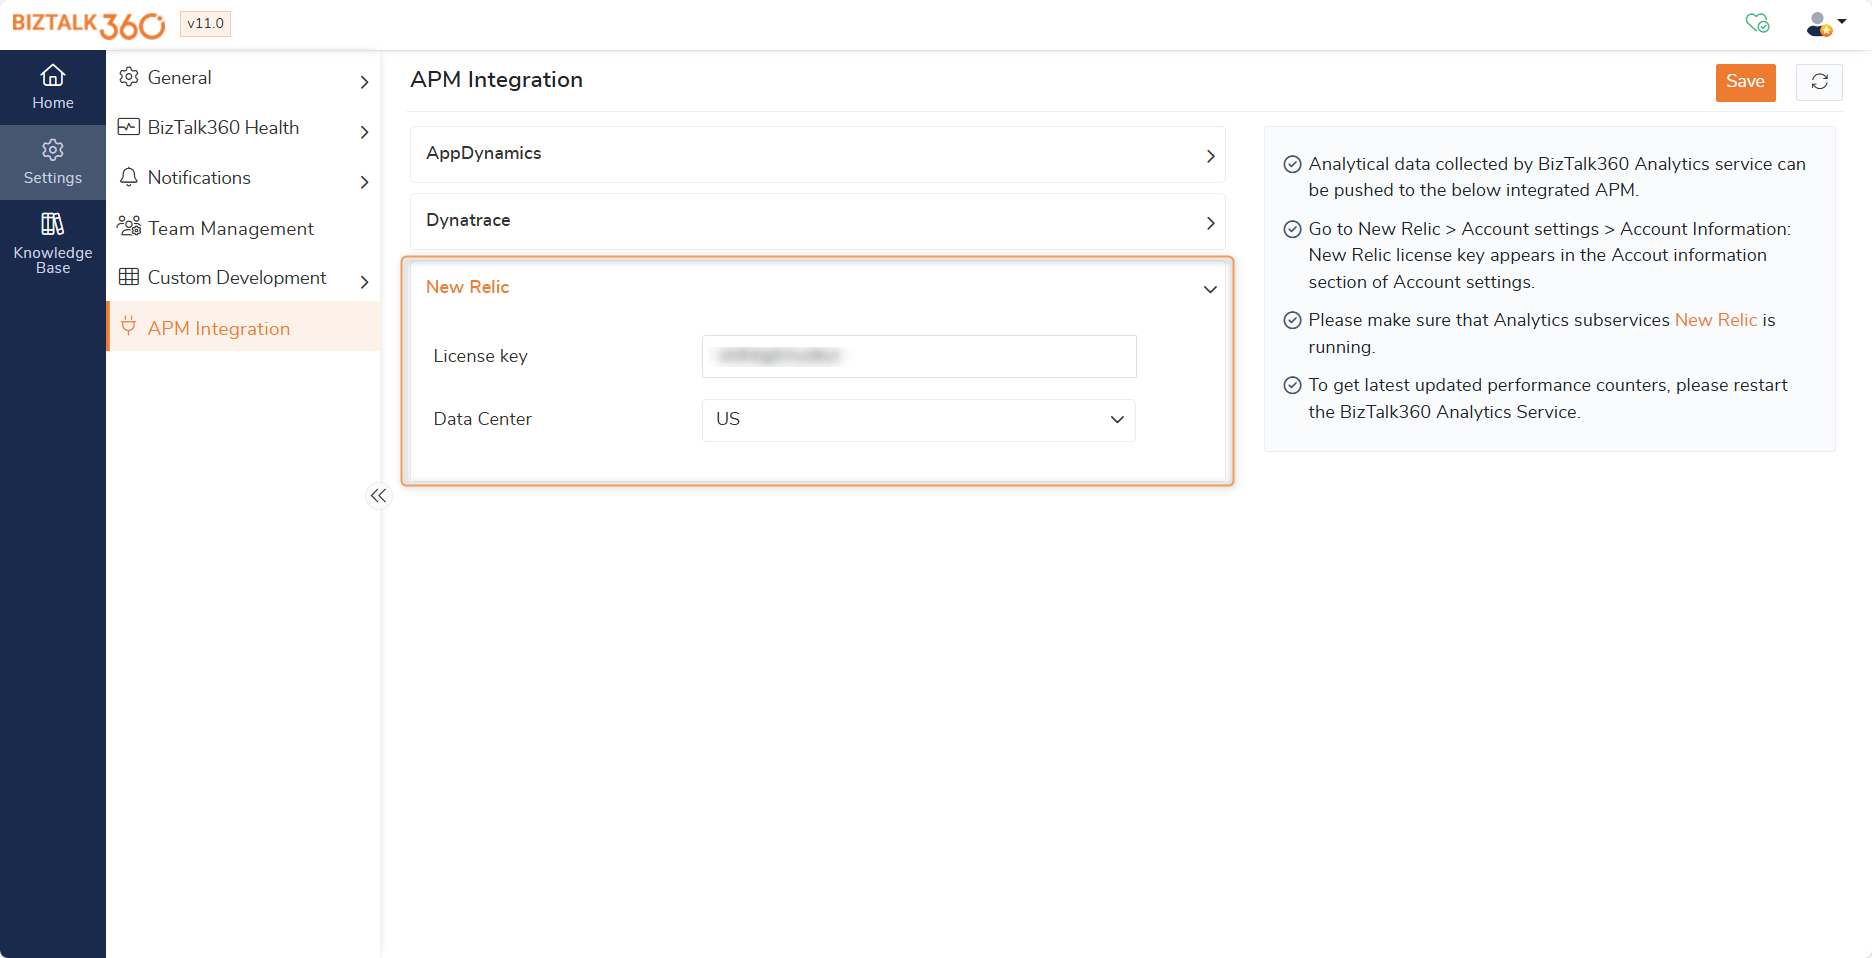
- Paste/enter the New Relic license key in the space provided
- Update the data center as either US or Europe
- Click Save to save the license key in BizTalk360. You will see a confirmation message as Successfully Saved
The important point to remember for integrating BizTalk360 with New Relic is that you need to make sure the New Relic sub service is running. You can check the status of the sub service by clicking on the Click here to check Analytics service Status link.
Viewing the BizTalk360 Analytics Data in New Relic
Once you have configured BizTalk360 with the New Relic key, and started the New Relic sub service, you will be able to see the analytics data in New Relic. Please note that it will take anywhere between 5 - 15 minutes for the data to be reflected as graphs in New Relic. We have 1 built in dashboard with 4 categorized metrics counter sections to display the performance data of BizTalk server. They will display multiple charts that depict the analytical data retrieved from the BizTalk server environment. The different monitoring dashboards (and underlying charts) available in New Relic are as follows:
BizTalk Servers Health
- CPU Usage
- Memory Usage
- Disk Free Space (Percentage)
- Average Disk Queue Length
- Network Performance
- IIS Requests per Sec
- IIS Worker Process: CPU Usage
- IIS Worker Process: Memory Usage
Host Performance
- Host Instance Performance by CPU
- Host Instance Performance by Memory
- Top 10 CPU Consuming Hosts
- Top 10 Memory Consuming Hosts
Messaging
- Documents receive/Second
- Documents processed/Second
- Inbound Latency (sec)
- Outbound Latency (sec)
- Outbound Adapter Latency (sec)
- Request-Response Latency
SQL Server
- SQL Server Instances by CPU
- SQL Server Instances by Memory
- SQL Agent Performance by CPU
- SQL Agent Performance by Memory
Throttling
- Message delivery throttling state
- Message publishing throttling state
- Active instance count
- Database size
- Database session
- Database session threshold
- In-process message count
- In-process message count threshold
- Message delivery incoming rate
- Message delivery outgoing rate
- Message publishing incoming rate
- Message publishing outgoing rate
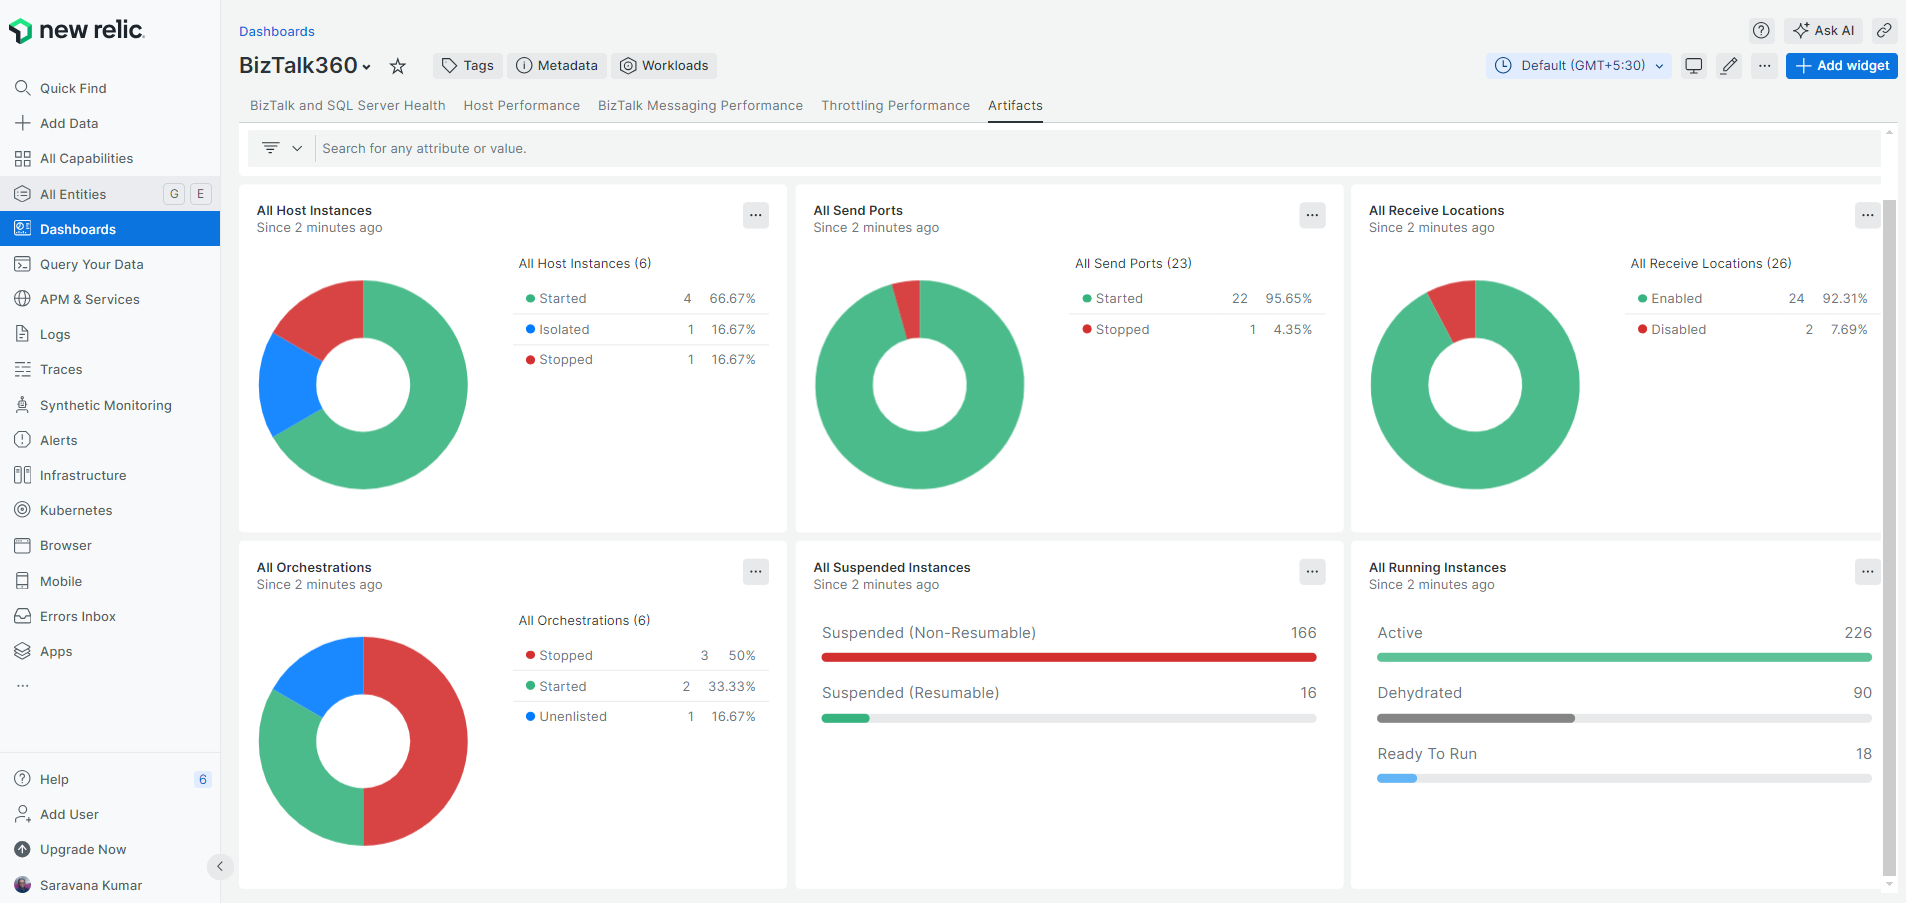
The Overview tab displays the key parameters of interest to the user as shown in the below picture.
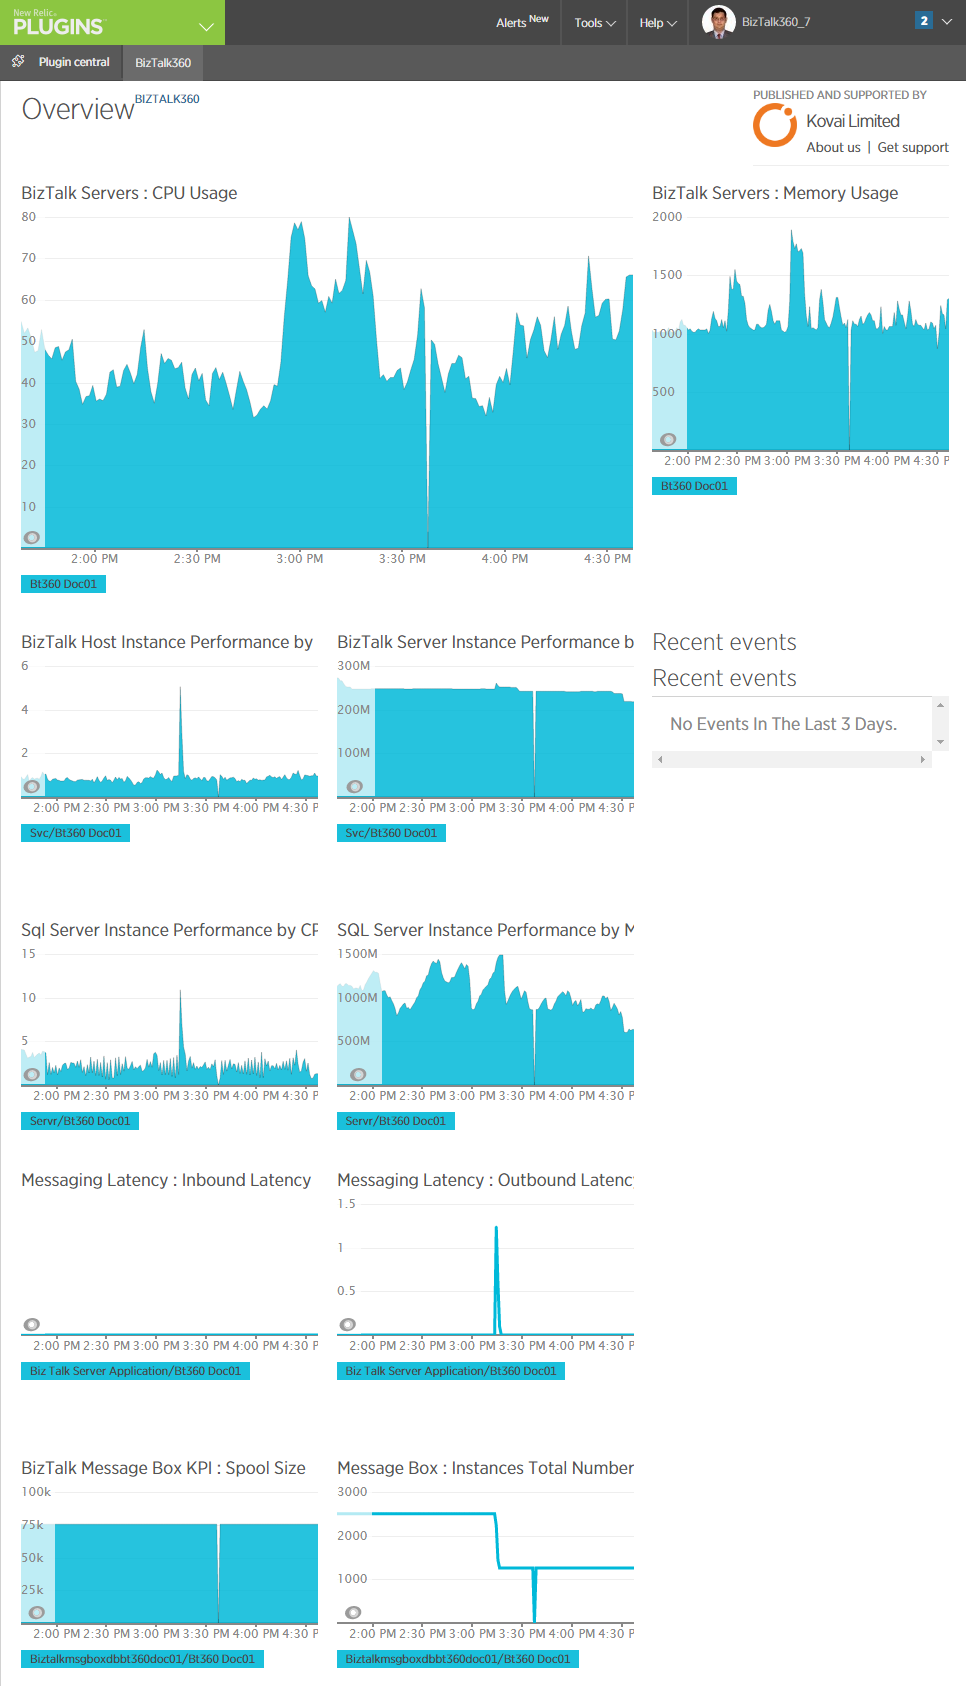
Default BizTalk360 Widgets in New Relic
Once you have configured BizTalk360 with the New Relic key, and started the New Relic sub service, you will be able to see the below administration widgets by default. This helps you to get a quick overview of your BizTalk environment. You can also edit the query of each widgets based on the business requirement.
- Count of Host Instances and its status.
- Count of Send ports and its states.
- Count of Receive locations and its states.
- Count of Orchestrations and its states.
- Count of Suspended Service instances.
- Count of Running Service instances.
