In BizTalk Server, Orchestrations are used as workflows to compose business processes. In the majority of the instances, Orchestrations will become a key part of the solution you have deployed, and to avoid any downtime, it's important to make sure the Orchestrations are in a healthy/expected state.
BizTalk360 assists administrators by monitoring the Orchestrations against a predefined status. For instance, you want to monitor the health of the Orchestration and want to be alerted when the status is not in a Started state. You can easily configure this in BizTalk360 by setting the expected state of the Orchestration to Started. By doing this, BizTalk360 will trigger an alert as soon as the Orchestration status is not in the Started state.
BizTalk360 allows you to set up monitoring for any desired state, which is not necessarily just the healthy running (Started) state. When it comes to BizTalk, there can be situations that, you have some Orchestrations in the Stopped or Unlisted state and you do not want someone to accidentally start it. In this section, we will see how to set up monitoring on the Orchestrations in a BizTalk application.
So, when you are configuring monitoring for Orchestrations, you can select one of the expected states from the drop-down. The meaning of the states are:
- Started – The Orchestration is expected to be in the started state
- Stopped – The Orchestration is expected to be in a stopped state
- Unenlisted – The Orchestration is expected to be in an unenlisted state
- Do not monitor – Selecting this option will disable monitoring for the selected Orchestration
- Unmapped - This means that no monitoring has yet been set up for the selected Orchestration
Setting Up Alerts for Orchestrations
- Log in to the BizTalk360 application.
- Navigate to Monitoring -> Manage Mapping -> Applications in the selected environment.
- Select the Application for which you want to set up Orchestration monitoring.
- Choose the Alarm (refer Manage Alarms) from the drop-down for which you would like to associate the alerts.
- Choose the Orchestration(s) that you wish to monitor.
- Select the check box against the orchestration you wanted to monitor.
- Set the value of the 'Expected State' by selecting from the value from the drop-down. For instance, if you want to be alerted when the Orchestration is not in the 'Started state', then you need to set the expected value in the drop-down to 'Started'.
- If the current state of the mapped artifacts matches the expected state, the monitor status will be set as Healthy. If there is a contradiction between the expected and current states, the monitor status will be set as Critical. If the mapped artifacts are in a critical state, they will be shown in the monitoring dashboard, group dashboard and listed in the errors and warnings page. Additionally, notifications will be sent to the users regarding the violation of the artifacts.
.gif)
Auto Correct Functionality
With the Auto Correct functionality, administrators can set up monitoring on any State-based artifact and let the monitoring service try to automatically heal the artifact any time when there is a mismatch between the Expected State and Current State. For instance, administrators can set up monitoring on the Orchestration(s) of an application and additionally set up the auto correct functionality for the Expected State of the artifact (which should be Started).
Whenever the orchestration goes gets stopped or Unenlisted, there will be a mismatch in the state and the auto correct will try to bring the artifact back to the expected state. If the operation is successful, the artifact will come back to the Expected State within the next monitoring service cycle (60 seconds).
Assuming you are still on the Orchestrations screen, follow the below steps to setup Auto Correct for Orchestrations:
- Select the check box of the orchestration for which you want to set up Auto Correct.
- Click the Auto Correct drop-down and select 'Enable'.
- Auto Correct will be enabled for the orchestration with the default values for Max Retry as 5 and Retry Count as 0.
.gif)
From the Applications_Monitoring alarm, all Orchestrations of the BizTalk EDI application need to be monitored, to be in the Stopped state. Also, Auto Correct needs to be Enabled.
When an Orchestration is not in the Expected State,
Attempt 1- Auto correct will attempt to bring the Orchestration to the expected state for the first time during the monitoring cycle. (Max Retry: 5, Attempt Count: 1). Let's assume the attempt was unsuccessful. You will receive an Auto Correction Alert email with the information. At this point, the monitoring dashboard will display the state of the artifact as Critical (2). When you click on the count, you will notice the auto correction steps that have been performed on the artifact.
Attempt 2 - Auto correct will attempt a retry for the second time during the next monitoring cycle (Max Retry: 5, Attempt Count: 2). Let's again assume the attempt was unsuccessful. You will receive the second auto correction email with the information.
Attempt 3 - Auto correct will attempt a retry for the third time during the next monitoring cycle (Max Retry: 5, Attempt Count: 3). Let's assume this attempt was successful. You will receive the third auto correction email with the information. Within the next few seconds, the monitoring dashboard will display the state of the artifact as healthy. Lastly, the attempt count will reset to 0 (Max Retry: 5, Attempt Count: 0)
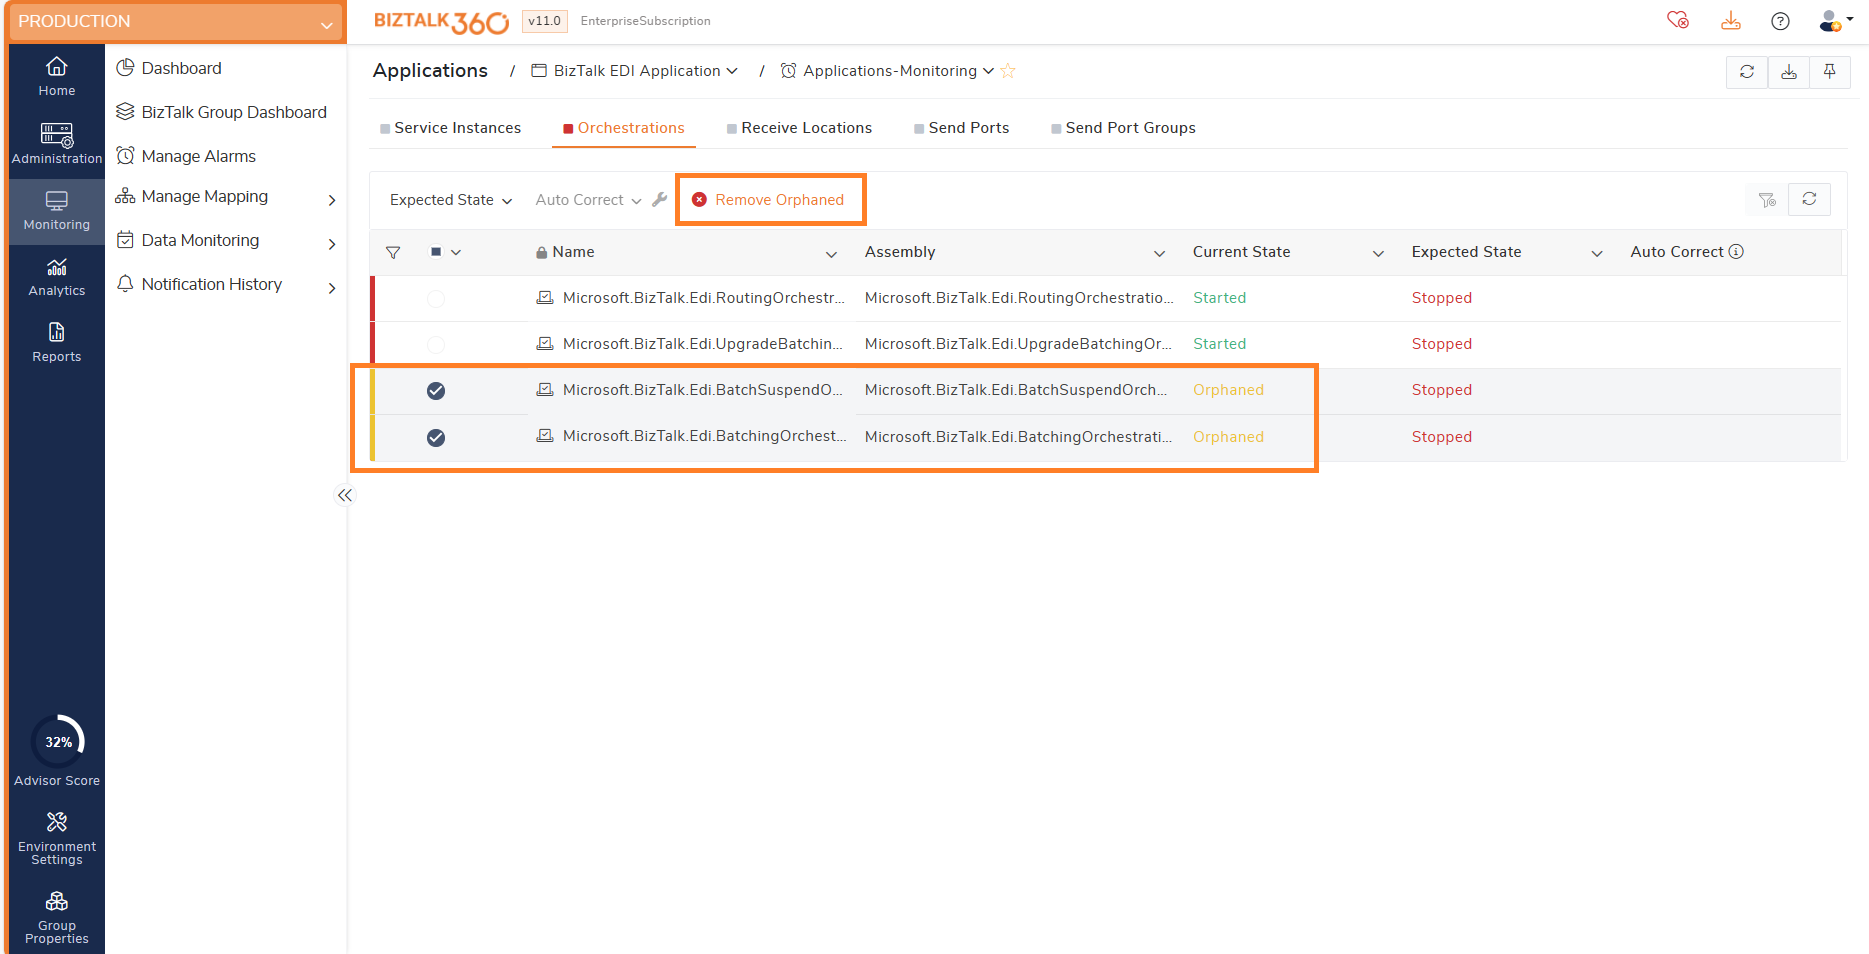
Remove Orphaned Orchestrations
When the mapped orchestrations were deleted from the BizTalk admin console or renamed, then that artifact is marked as orphaned. The monitor state of these orphaned artifacts is set as Warning .These orphaned artifacts can be removed right from the user interface by clicking the 'Remove Orphaned' button.