When a lot of transactions happen within the BizTalk servers, there may be chances of CPU and memory spikes, and resources will become unavailable. The performance data monitoring feature helps the administrator to understand the health of BizTalk/SQL Server with Windows performance metrics at frequent intervals.
Configure Performance Data Collection
As a first step for collecting performance and tracking data, the user must enable data collection on the settings side. Follow the below article to enable performance counters for data collection.
Once the data collection is enabled, the BizTalk360 system will collect the performance data for every minute and store it in a BizTalk360 database.
Setting up a Schedule for performance Data Monitoring
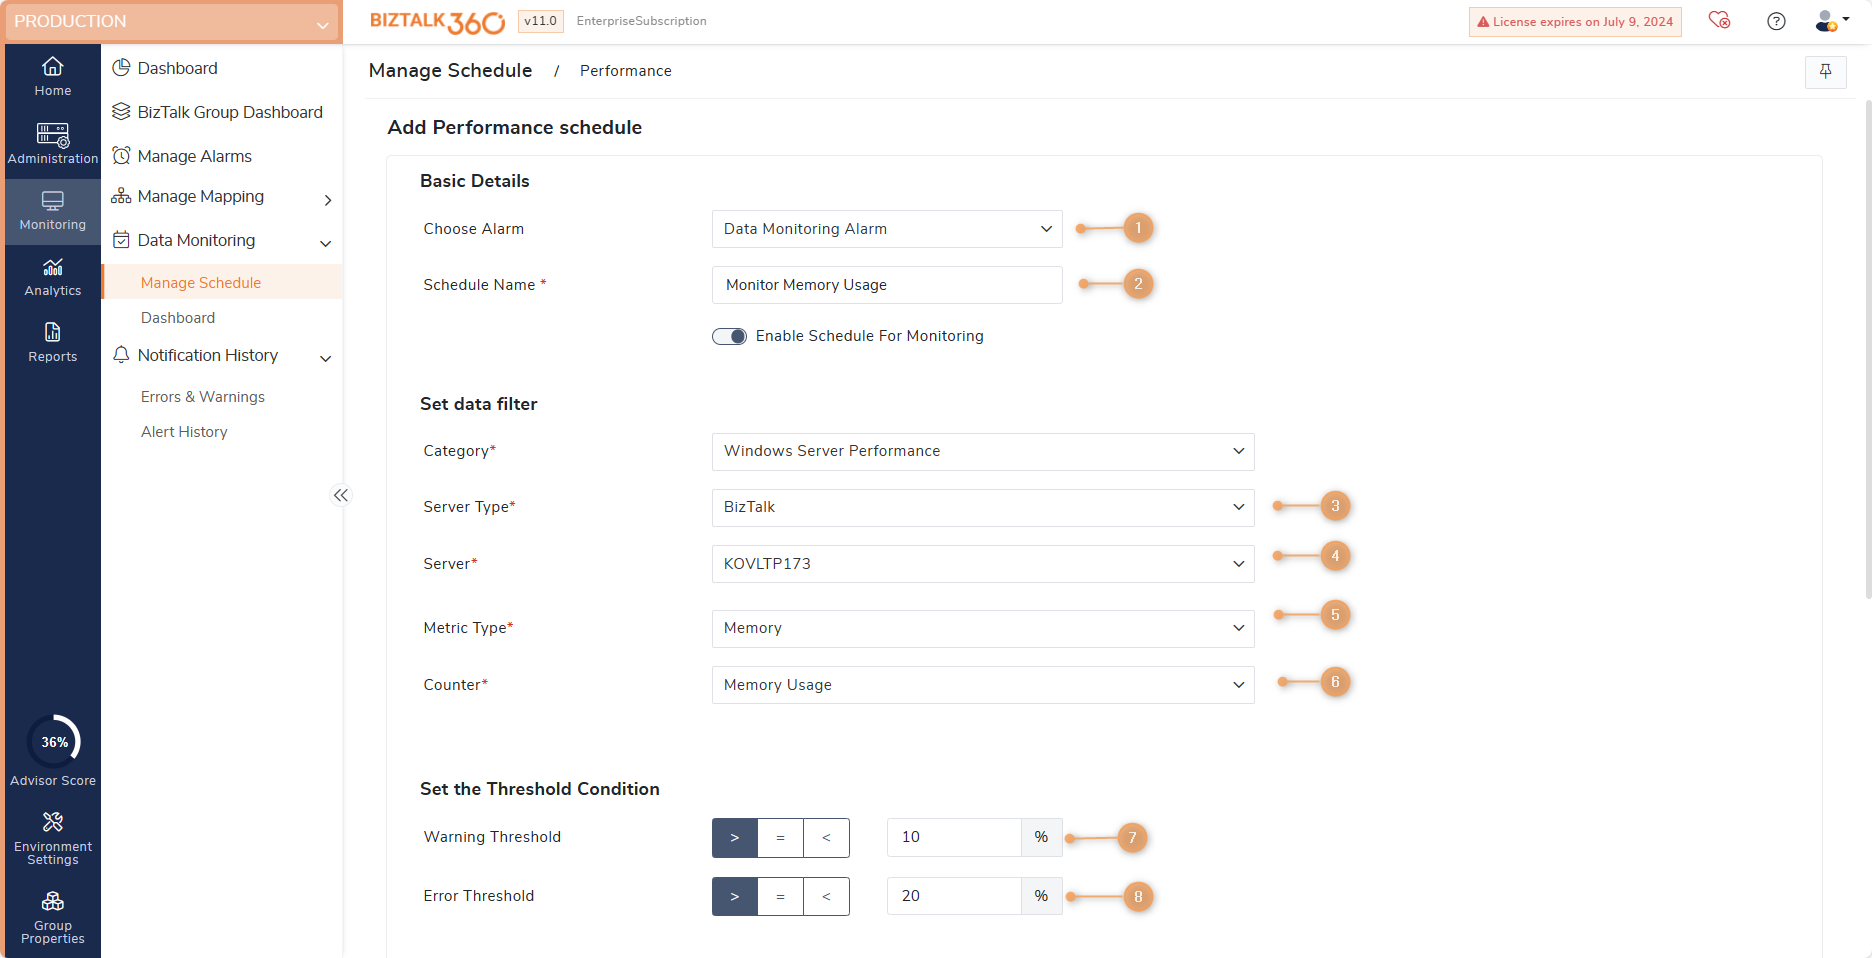
A schedule can be configured to define what counters need to be monitored and when they should be monitored. For example, you can configure a schedule to monitor the Windows performance metric (disk usage) of BizTalk or SQL every 15 minutes and get notified. Create a new schedule by going to Monitoring -> Data Monitoring -> More -> Performance -> Schedule. Click "Add Schedule" and follow the below steps.


- Choose Alarm - As mentioned above, the first step to set up Performance data monitoring is to create an alarm. Once you have created the alarm, the alarm name will be displayed in the drop-down. Select the alarm that should be used for performance data monitoring
- Schedule Name - A meaningful name for the performance monitor. The Schedule is created to monitor the Disk Usage of the BizTalk Server every 15 mins, so the Schedule name can be set as "Disk Usage Monitoring"
- Server Type - Select the server that needs to be monitored. You can select either the BizTalk server or SQL server (Create multiple schedules to monitor multiple server performance)
- Server - Based on the server type selection, BizTalk360 lists the available servers configured in the environment
- Metric Type - Select the metric type filters from the drop-down. In this example, we have chosen the windows metrics "Disk"
- Counter - The performance counter will get listed based on the Metric Type selected in step 5. Here the performance counter for Disks are Disk Usage, Average Disk Queue Length, and Average Disk Sec/Write will get listed, Disk Usage is chosen from the list in this example.
- Warning Threshold - Set the value when you want to be notified when there is a warning. First, select the Operator (> or =) and then set the warning value. For e.g., When the Disk usage is > 70, throw a warning
- Error Threshold - Set the value when you want to be notified when there is an error. First, select the Operator (> or =) and then set the error value. For e.g., When the Disk usage is > 80, throw an error
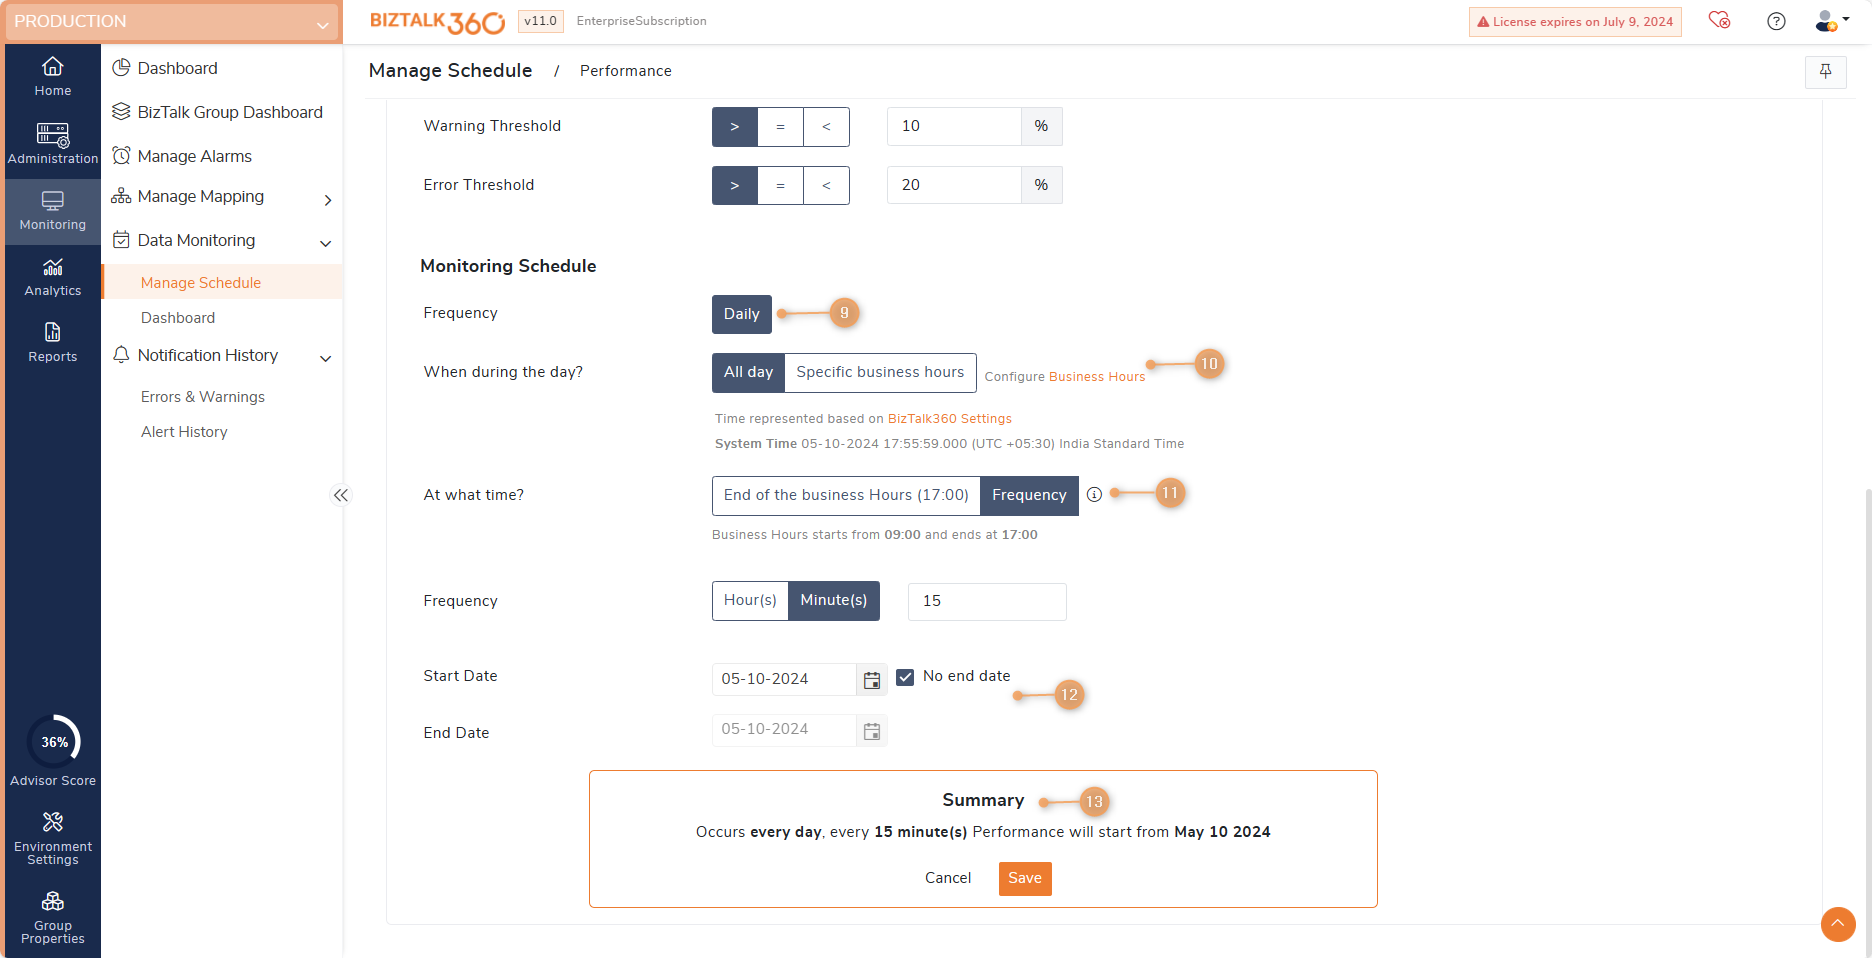
- Monitoring Schedule
- Frequency (How often you want to monitor) -The performance must be monitored very frequently to avoid server disaster. So only the Daily Option is only available here.
- When during the day - Select the time when the data monitor must execute on a particular day during business hours. You can customize your business hours by selecting the values from the Business Day Start and Business Day End options.
- At what time? -
- End Of the Business Day - For e.g., if the business end time specified is 5 PM (default value), the data monitor will execute exactly at 5 PM
- Frequency - Select the number of minutes/hours after which the data monitor should execute. E.g., For 15 minutes means the data monitor will execute once every 15 minutes
- Start Date / End Date - When you want to start/stop the scheduled execution. If you want the schedule to execute all the time choose No end date
- Summary - The summary information will automatically be listed based on the information selected in the previous steps. Click the Save button to store the schedule configuration.
Performace Data Execution Results
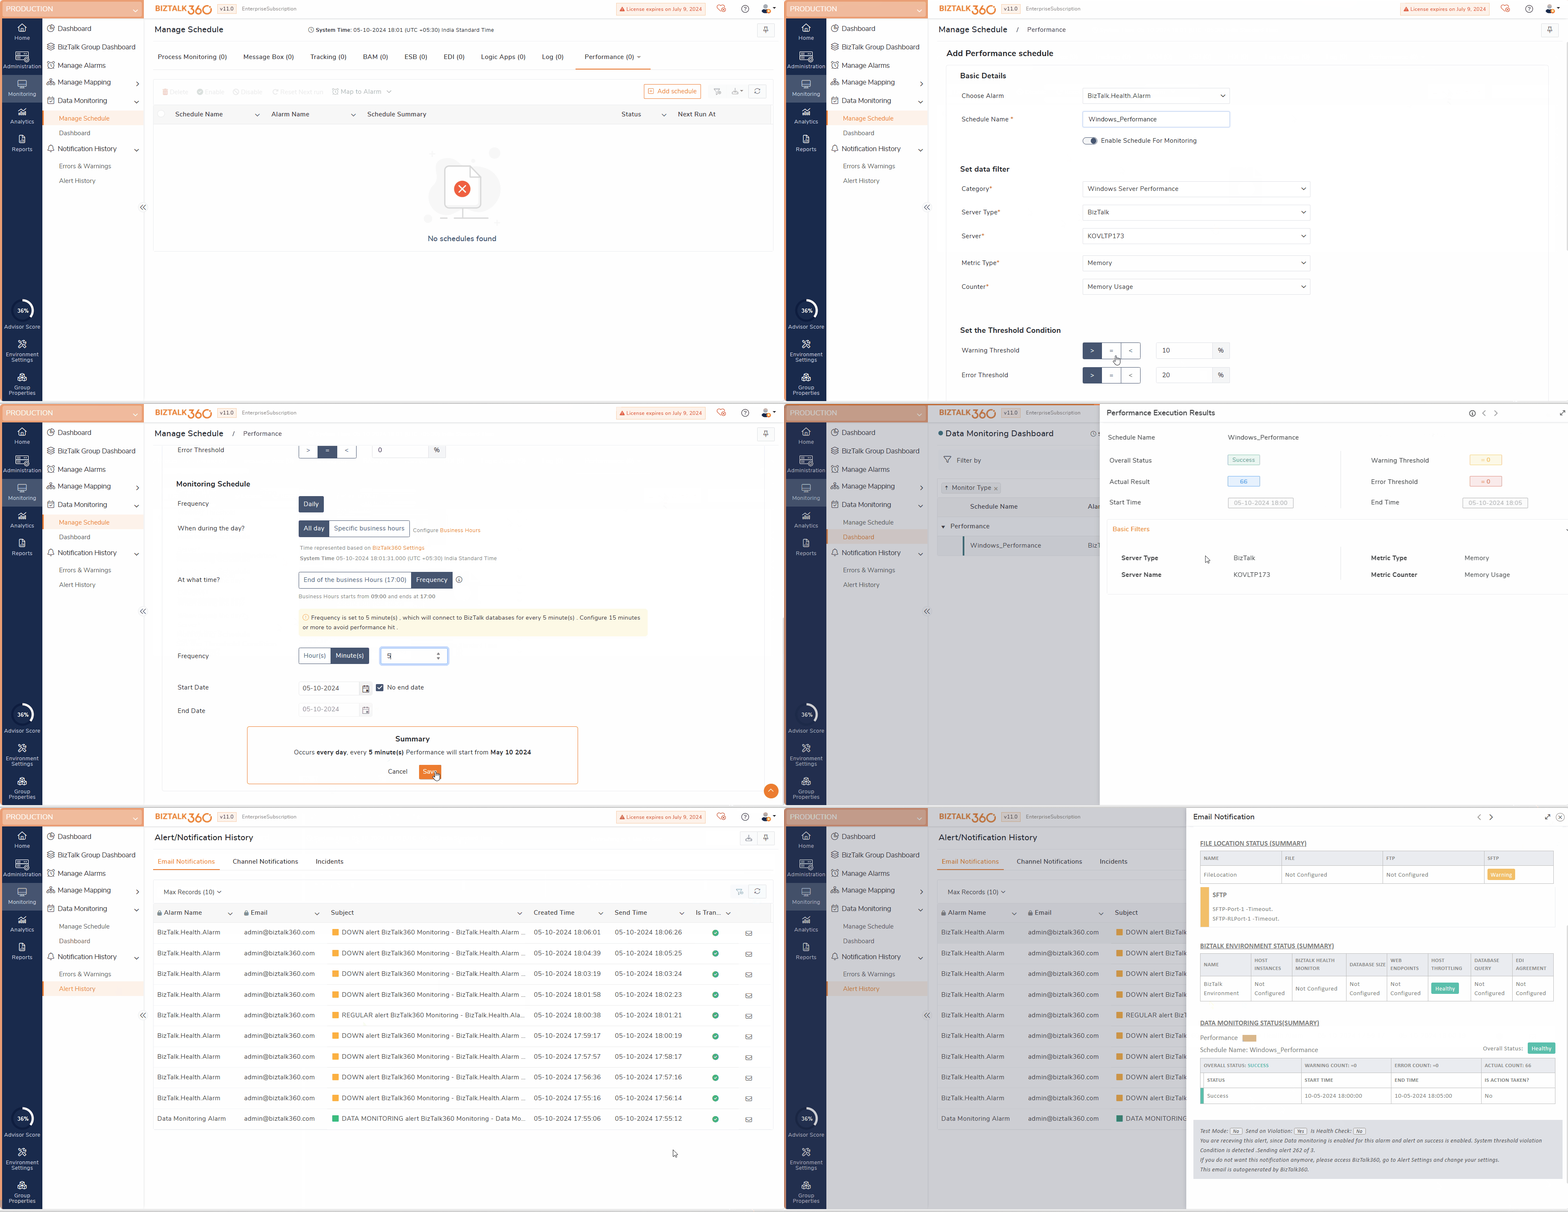
Once the schedules are created, it will get executed on the specified time frame. Once after the execution of schedules, it will be displayed in the data monitoring dashboard. You can go to the data monitoring dashboard and click on the respective schedule to view the data monitoring schedule execution results.

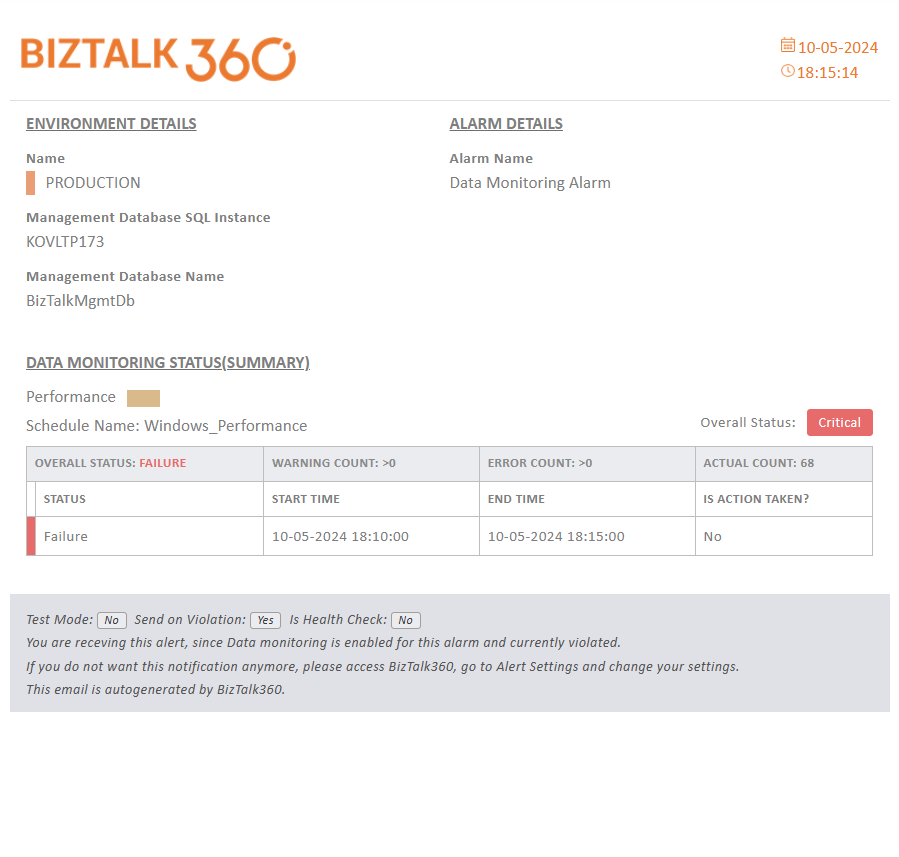
On successful schedule configuration, you should be able to see the Next Run Time of the scheduled execution in the Manage schedule section. The results will be notified to the configured email address or any other notification channel, and they will also be updated in the dashboard.

- To get an accurate result make sure the analytics service is running all the time and the respective performance counter is chosen for data collection
- Follow the BizTalk360 purging policy to avoid data growth
- If you don't want healthy notification, Say you wish to get notified only when there is an error/warning, then disable the option "Notify on Success" while creating the data monitoring alarm
- Set the monitoring frequency to less than 15 mins. Update the "Data Monitoring minimum frequency" value under Monitoring and Notification in the System setting.
Below are sample kinds of performance data that can be monitored:
- Windows performance - Monitor CPU or Memory usage of the last 1 hour or during a specific period of time.
- BizTalk messaging performance - monitor processed message count at application or artifacts level.
- BizTalk host performance - monitor active instance count of each host instances, CPU or memory usage of host instances.
- Tracking data performance - Monitor (Failure or Success count of ports, schema, and so on).