For a healthy BizTalk environment, it’s important to keep an eye on the number of service instances in the environment. Having a large number of suspended service instances might bloat your message box database and adversely affect the overall performance of your environment. In some cases, it could be an issue with the environment, ex: If the host instance is not started and you get messages that kick off the service instances, then those instances will be in a "Ready to Run" state until the host instance is started. If no one starts that host instance, the service instances are going to get accumulated bloating the message box.
Typically support people keep an eye on the service instances count via the BizTalk Administrator group hub page. But it’s not the ideal solution for a human being to always keep an eye on this count. The person who is monitoring this, need to be a BizTalk expert and understand the importance of each state. The group hub page only displays the instance count, and it won't tell you whether they are expected count or not.
The service instances can be in any of the below states:
Ready to Run
Scheduled
Dehydrated
Suspended Resumable
Suspended non-resumable.
Active
BizTalk360 allows you to set the Warning and Error threshold levels (instances count) for each one of the above states at the application level. Once the number of instances increases above the threshold, the system will send a notification alert.
Setting Up Alerts for Service Instances
Click the expand button against 'Manage Mapping' tab and click the 'Applications' link.
Select the Application for which you want to set up the monitoring.
Select the Alarm name (see Manage Alarms) from the drop-down for which you would like to associate the alerts.
Under service instance tab .Choose the Service Instance States which will open the Monitoring configuration blade .
Enable Monitoring -Toggle this option to start monitoring service instances.You can temporarily disable it during maintenance or known activities to prevent unnecessary alerts and re-enable it afterward
Configure Warning and Error Threshold .For example,Warn if instance count is >1 and Trigger and Error if instance count exceeds 10.
By default the configuration includes 2 non editable filters application name and instance state .
Application Name – Ensures monitoring is scoped to a specific selected BizTalk application.
Instance State – Focuses monitoring on the state of the service instances, such as Ready to Run, Suspended, or Dehydrated.
You can refine monitoring further by applying advanced filters such as service ,error and host details. These filters allow you to precisely target the service instances you want to monitor.
Service Name – Monitor only specific services within an application.
Host Name – Target service instances running on a specific host.
Service Class – Filter by service class (e.g., orchestration, adapter, or messaging) for more granular monitoring.
Error code -Monitor instances that fail with a specific error code, helping to quickly identify known issues.
Error Description -Filter instances based on the error message or description.
Say in the Logistic Complany , one of the significant Application is OrderProcessing , You can apply filter to monitor only the host responsible for processing orders. If the host instance not started ,it might produce a specific error code each time a message fails to process. By monitoring this error code, admins can immediately detect and act on this known issue.
Click 'Save' to apply your settings . Upon configuration the monitoring status of the configured instances will be displayed along with Current instance count and Configured Warning and Error thresholds.
Note : The default threshold levels which configured in Environment settings->Mapping Configurations will be applied for monitoring.
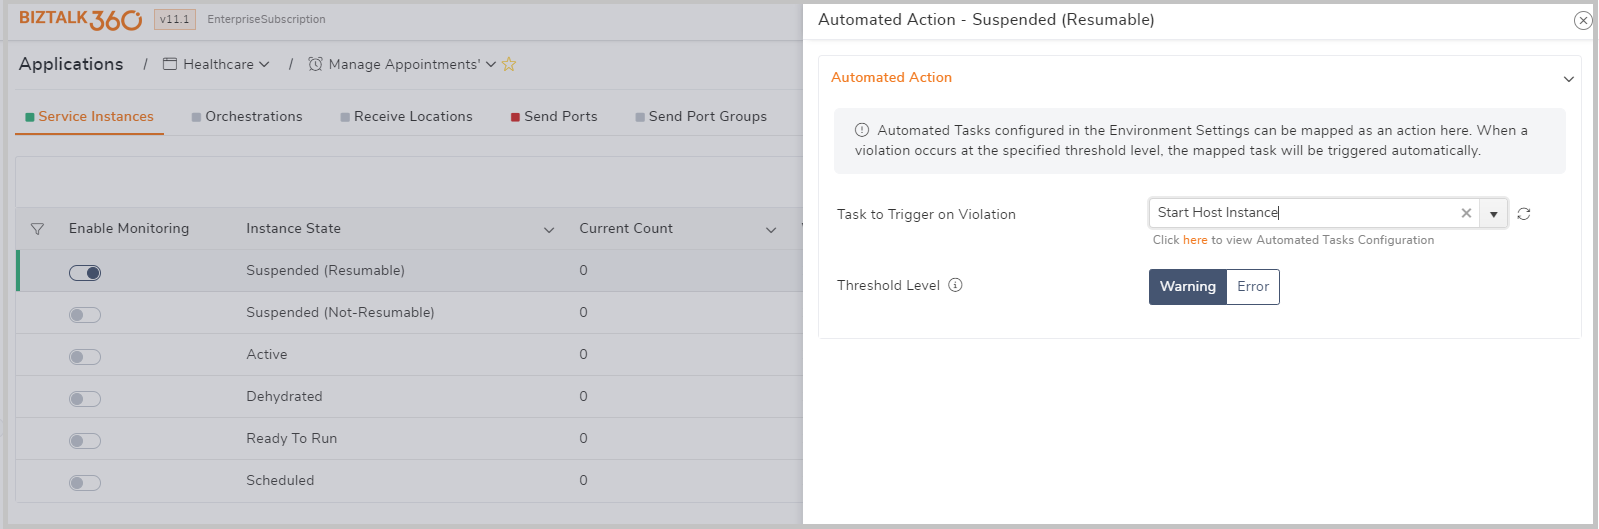
Integrate Automated Tasks
Service Instance Monitoring’s automated actions trigger corrective measures for the service instances. These actions can include starting or stopping artifacts, NT Services, Host Instances, or executing predefined PowerShell scripts.
Service instances can encounter issues such as suspended messages, failed orchestrations, or prolonged processing times. You can monitor service instances by configuring a threshold limit, and if the threshold limit is reached, take automated action to start host instances or execute a script to suspend or terminate the instances.