Release Date: 6th April 2022
 Important Updates
BizTalk360 client frameworks are upgraded to the latest versions(Angular 13, Kendo UI, Go Js 2.2).
Note: BizTalk360 supports the latest version of chromium browsers. IE11 browser is deprecated for the latest version of Angular.
 New features
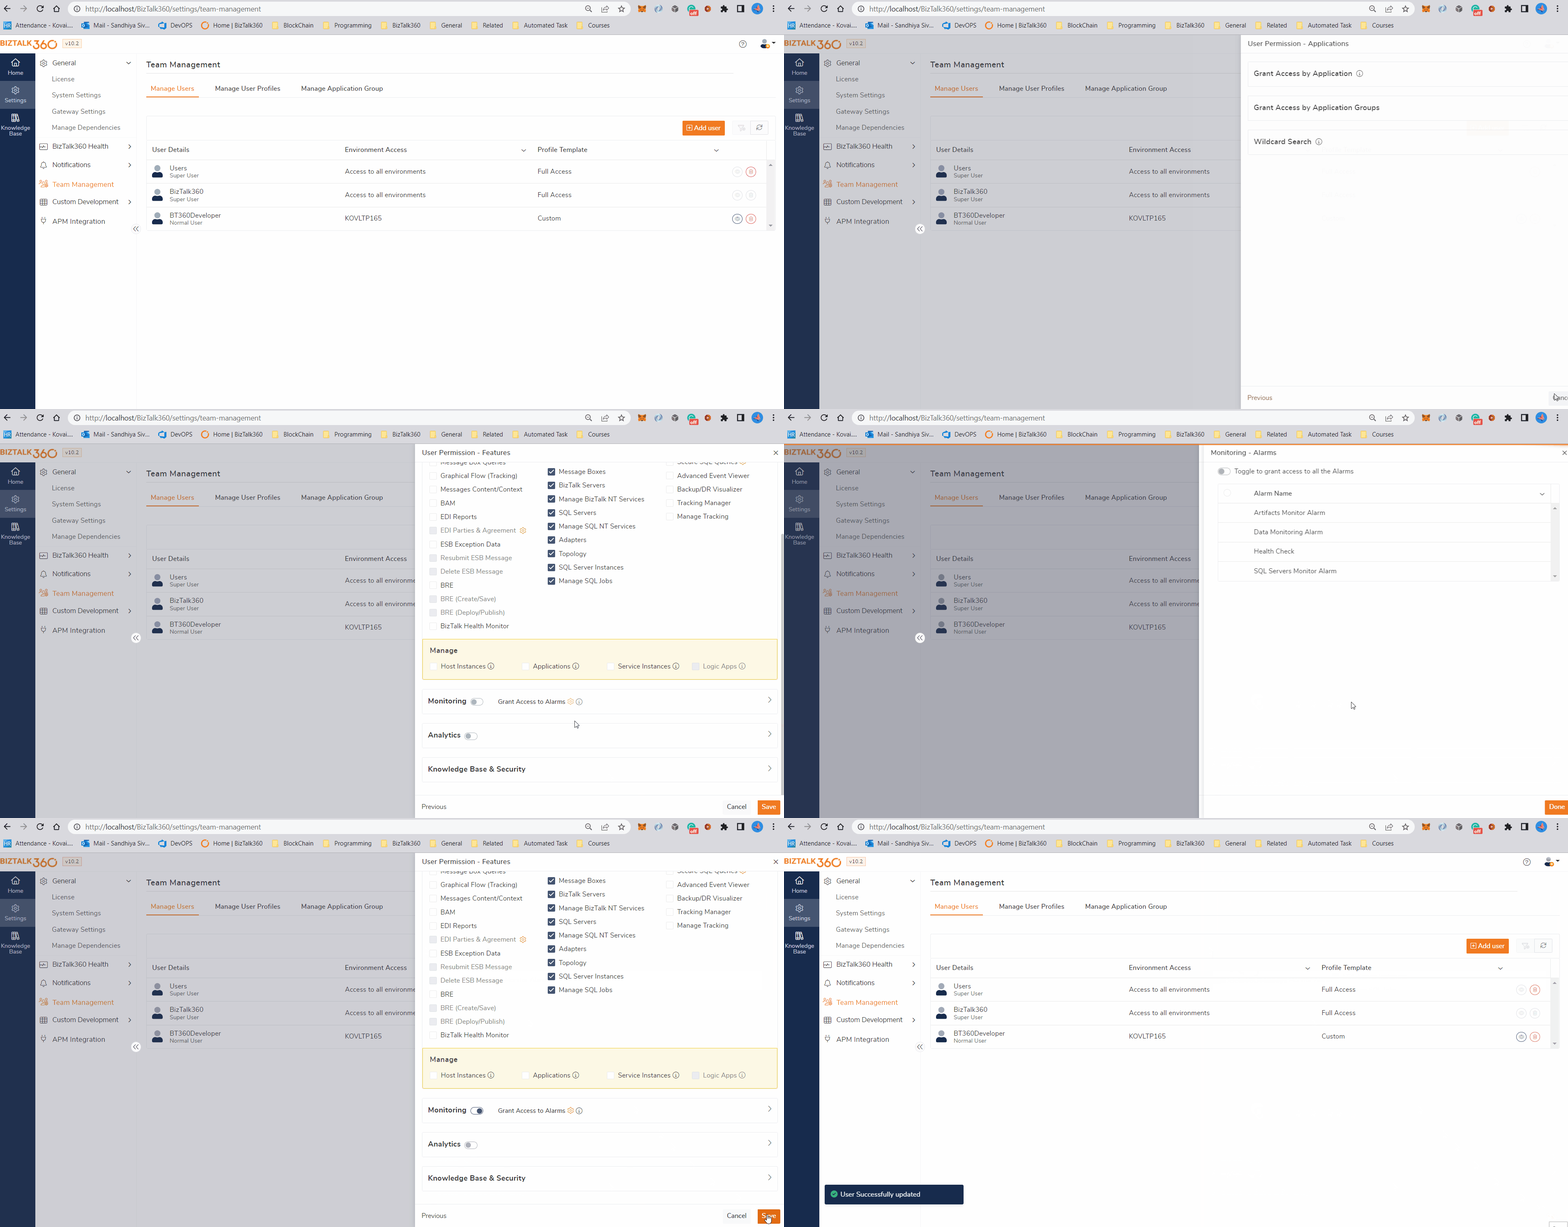
Alarm User Access Policy
This feature allows the administrators to define which alarms can be accessed by different groups of users. Non-super users can view only the permitted alarms and their details in the Manage alarms, Dashboard, Group dashboard, Manage Mapping, Data monitoring, Notification History, and Governance & Audit sections.
Integration of BizTalk Server 2020 Audit Log
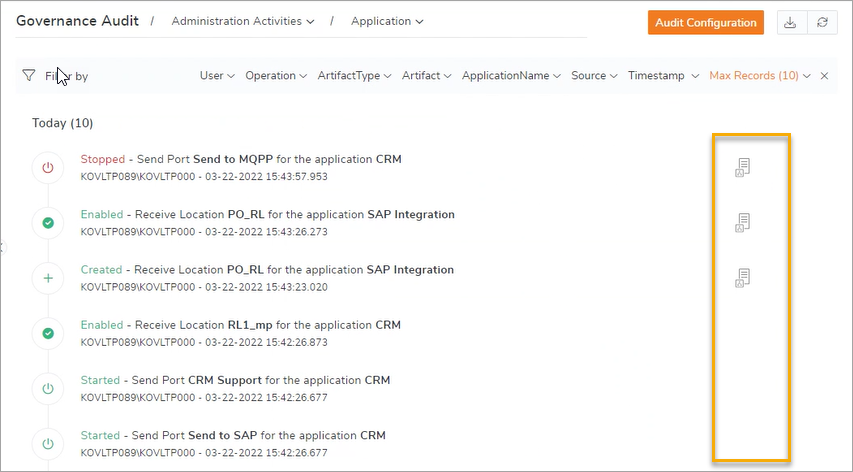
BizTalk Application, Application Artifacts, and Tracking activities are audited in the BizTalk Server 2020 and are now incorporated into the BizTalk360 Governance and Audit section. This integration provides the BizTalk360 users, a platform to view consolidated activities and export the audit logs which are captured in the BizTalk Management database and the BizTalk360 Application.
Saved Queries in Search Artifacts
This feature holds a rich query builder which allows you to save the query which you used to filter/search the artefacts. The saved queries are easily manageable and accessible by all the users who have access to the queries. For quick access, the query results can be pinned to the Administration/Analytics dashboard.
NT Service type monitoring (Startup Type and Logon As)
This feature enables you to monitor the start-up type and log on as a user for the NT Services running in BizTalk and SQL servers. Monitor the NT Service start-up type by setting the expected start-up type as Manual, Automatic, Disabled, and expected to log on as local, domain users.
Publish the Analytics Reports in the Notification channels
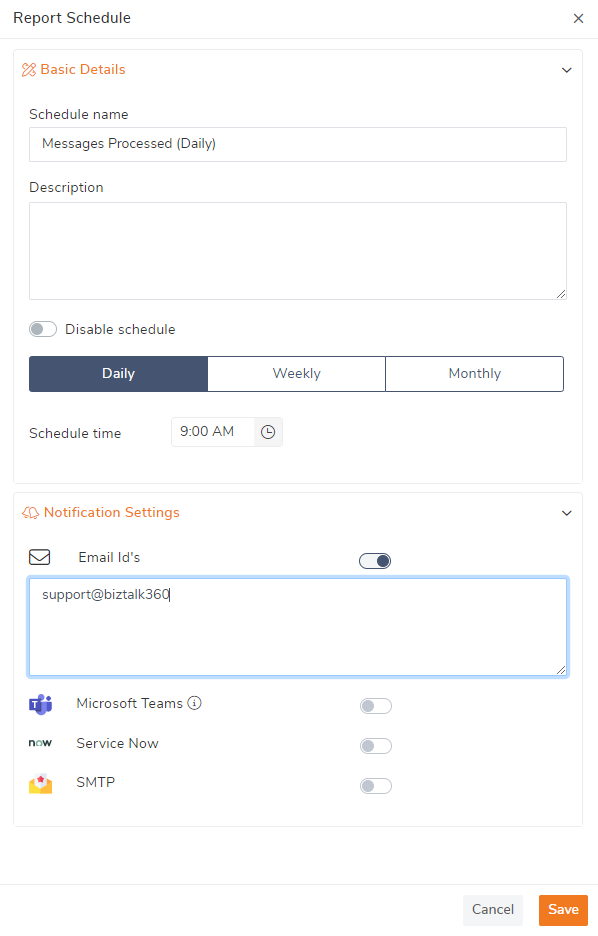
The BizTalk360 Reporting feature enables you to send the BizTalk and SQL server performance as a report to email based on schedule configuration. This feature is now extended to support other notification channels like Microsoft Teams, ServiceNow and SMTP.
Twilio - SMS Notification channel
Twilio SMS notification integration allows viewing the status of monitored artefacts as SMS messages. Configure the credentials like Auth Token, Account SID and From Number which are required to process SMS notifications through the Twilio messaging service.
Integrated Troubleshooter
In the Integrated Troubleshooter, we included the following features:
- Generate a report of the troubleshooting results in PDF Format
- Check the WMI, RPC, SQL Server Port(1433) and TCP Port permission for BizTalk and SQL Server(s)
- Now, different users are allowed to Troubleshoot apart from logon-on users.
 Enhancements
Back-Up & DR supports SQL Server Always On
The Back-Up & DR feature now supports SQL Server Always On configuration. Extend to support optional parameters in the Back-Up DR Job.
Download and Send BHM Reports
The ability to download the BHM Reports from the Administration section. In addition to this, BHM Reports can be sent to the users via email.
ESB Configuration
- The exception and itinerary DB which are configured in different SQL instances can be updated
- ESB Endpoints configuration in environment settings has been made more intuitive
Data Monitoring Calendar view
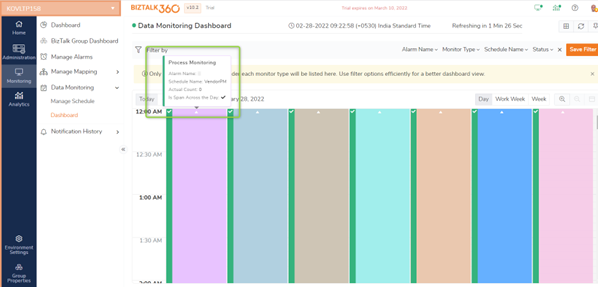
The Calendar View of the Data Monitoring dashboard holds a rich UI, with which you can easily view the consolidated results of data monitoring schedules. This feature facilitates easy navigation and representation of consolidated execution results. It has three different views, being Day, Week, and Work Week (Mon-Fri).
Data Monitoring 5 Mins frequency support
Users are allowed to create a schedule with a minimum of 5 mins frequency. This configuration needs to be done for all the environments globally in the System Settings.
Data Monitoring supports span across days' schedules
The Data Monitoring schedules can now be created with start and end times that can span multiple days. This allows monitoring of the data points span across the days.
Event Log Data Monitoring
Users can configure multiple Event IDs for monitoring in a single schedule with the same monitoring configuration.
Data Monitoring Age condition
Data Monitoring Age condition supports Hours and Days in addition to minutes
Configuration Alarms during the maintenance
Configure schedules for maintenance and map the alarms per schedule for continuous monitoring during the maintenance period. Similarly, configure the alarms to continue monitoring during the Business holidays.
Not Auto Corrected /Unmapped artefacts indication
In the Application Artifacts mapping section an indication of which artefacts in the environment are not mapped to any of the alarms for monitoring. Also, a quick view shows the artefacts which are not enabled for auto-healing.
Preserve User preferences
This improves the user experience by preserving their preferences in their user profile
- Preserve the user selection Grid Layout or Card Layouts in Manage Alarms, Manage License, etc.,
- In the Monitoring Dashboard, preserve the filters like Collapsed View or Full View, and Dark/Light Modes
- Users can choose which screen they prefer to land on while loading BizTalk360; either to the overall environment section or the Administrator /Monitoring /Analytics dashboard
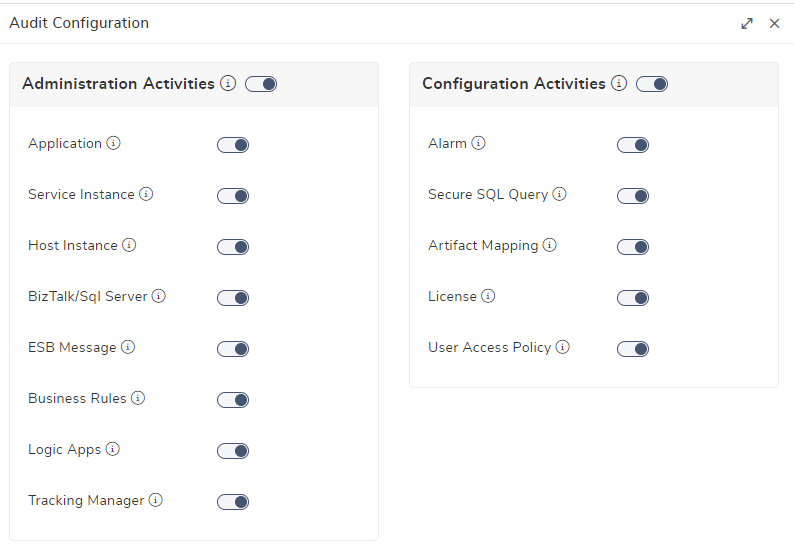
Audit Configuration
With this enhancement, the Audit log is captured based on the selected features in the Audit Configuration.
Stored Procedure Execution in Secure SQL Query
By enabling or disabling the "Allow stored Procedure" option, users can define whether Stored Procedures can be executed in Secure SQL Query.
System Date-Time Format
In the System Settings, the system date-time format configuration is added. The configured value will be considered as the default date-time value for any new user created.
APM Integration (New Relic, Dynatrace and AppDynamics)
- Analytics Data points are pushed to the new Metrics API in New Relic Integration. The user can configure their preferred datacentre (Europe or US Region)
- Support to Auth Token bearer implementation to Dynatrace API's
- AppDynamics is upgraded with the latest packages
Performance Improvement
- Alarm Execution - In case multiple alarms are configured in the environment, the execution of monitoring cycles happens parallel. With this, the result in the dashboard, Email, and Auto-correction will be updated faster.
- Overall environment statistical information API performance is improved
- Optimized the Errors and Warning API in monitoring
 Bug fixes
Administration
- BHM Default profile is not getting listed in the Administration section
- When the backup transport is configured for the send ports, entry of the send ports is duplicated in the search artefacts
- The search URI filter option is missing in Search Artifacts for the send ports
- The application link is not working after closing Application Properties
- Getting exceptions in the tracking queries when using URI filter contains single quotes
- In SQL Server Logged On failure, the exception is captured in the event log when ESB uses a custom name other than the default EsbException Db
- In Secure SQL queries, while editing the query, the results of the previous execution disappear
Monitoring
- In the Alarm email notification, the "To" list displays the first recipient's email address alone
- When using HTML tags in the Manage Alarm description, validation of the description is missing. Also, alerts are not triggered for the Alarm.
- SMTP Notification channel description is not displayed in the native language
- In the manage alarms section, when the user chooses select all, it shows all the alarms which are not present in the search
- In the Application Artefacts Mapping screen, filter the artefacts by the state such as enabled or disabled etc. The expected state and auto-correct option are not enabled to configure.
- In the Data Monitoring schedule, while editing the configuration, the Save button is not enabled.
- In Process monitoring configuration, Receive ports and Send ports are not displayed in Alphabetical order.
- Response time condition of web endpoint monitoring results is showing wrongly
General
- An issue with the users who have been granted access by Application Groups is not reflected immediately