Understanding Alarms
The first step in monitoring using BizTalk360 is to create Alarms. Alarms in BizTalk360 act like a package that contains all the components that need to be monitored.
Example: You may want to monitor artifacts in a few BizTalk applications together.
Alarms help you to achieve this objective. While creating the alarm, you can also configure how you want to receive the alerts, by configuring one or more of the available Notification channels, like e-mail, SMS, Slack, ServiceNow, and so on.
Alarm types
In BizTalk360, at the top level there are 3 main types of alarms you can create:
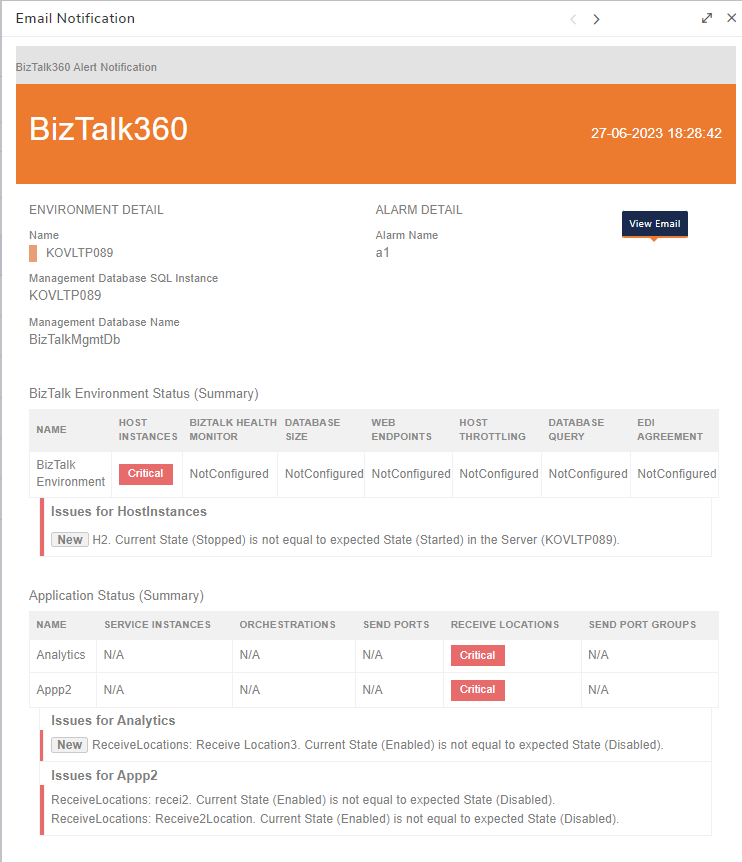
- Threshold violation alarms - used when a condition is violated, for example, a disabled Receive Location
- Health Check Notification alarms - used for scheduled Health/Status check
- Data Monitoring alarms - used to set up monitoring against message processing
The Create Alarm screen is flexible; you can simply create a Threshold alarm, a Health Check alarm, or a Data Monitoring alarm. You can also consolidate all mentioned alarm types in the same alarm.
Note: Normal User has some limitations to manage alarms. However, Super Users can provide access to Normal users or NT group users to create, manage and monitor alarms with its monitoring dashboard.
Threshold violation alarms
In BizTalk360, you can create threshold alarms to monitor and alert you when specific threshold conditions are violated in your BizTalk Server environment. By using threshold alarms in BizTalk360, BizTalk administrators and operators can stay on top of critical issues, ensuring that potential problems are detected early using the down alerts from BizTalk360 and resolved proactively.
Up alert:
The up alert will be sent once the alarm mappings become healthy along with the details of resolved issues. So that you don't have to revisit the down alerts. You can configure that up alert can be sent to email & Notification channel or email only. These alerts would offer you a deeper understanding of the changes made. By including this information, you can gain insights into the corrections or updates.
Auto reset:
BizTalk360 have the privilege of limiting the number of alerts that will be sent (otherwise you may end up with an indefinite number of alerts being received for the same issue).
In case, when there is any suspended message in BizTalk for the Orchestration. This sends 3 Down alert email for the instance suspended in BizTalk in the interval of 10mins. When another orchestration instance suspended after 30mins of down alerts, there is no further alerts being sent because it's reached to the maximum limit 3.
In this situation you can utilize the alarm auto reset that is another main functionality helps to reset the alarm once the specified notification limit is reached. So, the alarm will be reset either by "new violation" or "by mentioned time interval".
When you are user who wants to be updated on any new violations and working the existing violation already, this alarm auto rest based on "new violation" can be configured. so, the alarm will be reset only when the new issue occurs and that will be aligned on top with a new tag and the existing issues will be present below to that.
Alert schedule:
You can configure threshold alarms with an alert schedule to control when you want to be notified of threshold violations. This feature allows you to set specific days and times when the alerts should be active and when they should remain silent. This way, you can avoid receiving notifications during non-business hours or when they are not needed.
For instance when you do not want to be notified of threshold violation all day and have a bunch of notifications. You can configure the alert schedule for only during specific times on days (Monday-Friday, between 09:00 and 17:00), If you want to monitor between specific business hours and you enter a Start Time, BizTalk360 automatically sets the End Time to one hour later than the Start time.
Adding to that, we have a customized option like if you want to receive the auto-correct and up alerts beyond the scheduled time. This can be beneficial for users who prefer to stay updated and receive immediate alerts whenever there are changes available.
Think of a scenario,
- When you configured for threshold alert schedule only on business hours 9-5 pm
- an error occurs at 3 pm and gets down alerts
- The error may get fixed by 6 pm, and you won't be getting up alert instantly.
In this case, by enabling the "Send up alert beyond the schedule" option. You will be notified immediately when things become normal even out of schedule timing as well.
We have another powerful feature "Auto Correct", You can enable it to make things as expected(normal) by BizTalk360(monitoring service) itself. By enabling the "Send Auto correct alert beyond the schedule" option. You will be notified immediately when things become normal even out of schedule timing as well.
Health Check Notification alarms
One of the key features of BizTalk360 is the ability to create health monitoring alerts. These alerts allow support personnel to keep track of the overall health status of BizTalk environments on a regular basis. Set the days and times when you want the alarm to run. For example, you can set it to run on weekdays (Monday to Friday) at 9 AM.
BizTalk360 will now automatically run the health check at the scheduled days and times, and if any issues meet the alarm criteria, it will generate the appropriate notifications based on the severity level you set.
By setting up such periodic health monitoring alarms, support personnel can proactively identify and address potential issues in the BizTalk environment, ensuring smooth operations and reducing the risk of downtime or failures.
Data Monitoring alarms
Data Monitoring alarms enable users to set up automated monitoring for different aspects of BizTalk Server and related components. In addition to providing query builders to manually search for specific information in BizTalk environments, BizTalk360 offers the ability to monitor various data points and activities through Data Monitoring alarms.
BizTalk360 contains multiple query builders to, for example, query the Message Box database to search for running and suspended service instances. You can also use a query builder to look out for information about Tracked Service Instances and Tracked Message Events. Similarly, query builders exist to query BAM views, perform EDI activity search, and filter out the ESB exceptions.
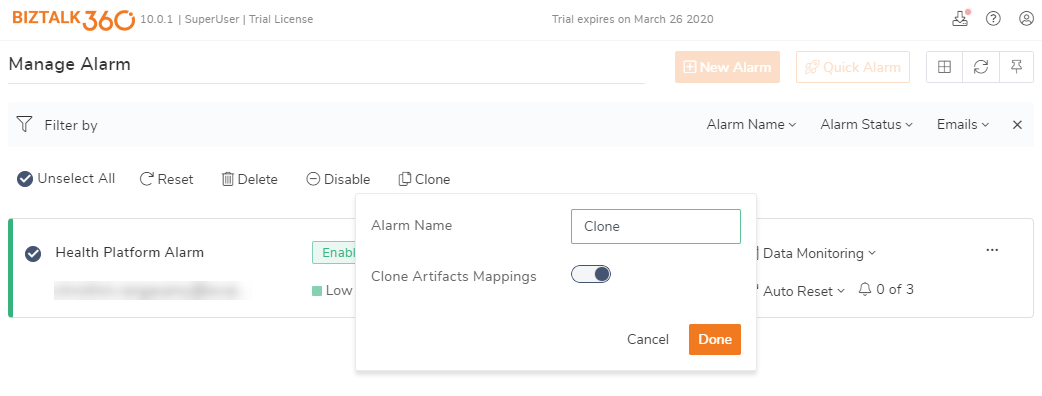
Clone Alarm
The Clone Alarm option allows you to copy all settings from one alarm to another, including configuration about all the monitored components.
Follow the below steps to clone an Alarm:
- In the 'Manage Alarms' screen, select an existing alarm; a button bar appears
- In the button bar, click 'Clone'. A window appears where you can provide the following:
- Alarm configuration - All the configuration details of an alarm
- Artifacts Mappings - Applications, BizTalk/SQL Servers, BizTalk Environment, Queues, File Locations artifacts mapped for monitoring and the data monitoring configurations
- Provide the 'Alarm Name' of the new alarm
- To copy artifact mappings along with alarm configuration, enable the 'Clone Alarm with Artifacts Mappings' option
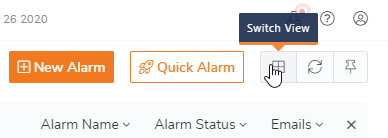
Switch View
The Switch View option allows you to change card or list view of the manage alarms page. Once the view is selected the same view persists until the user changes the view for next time. let see views in detail below
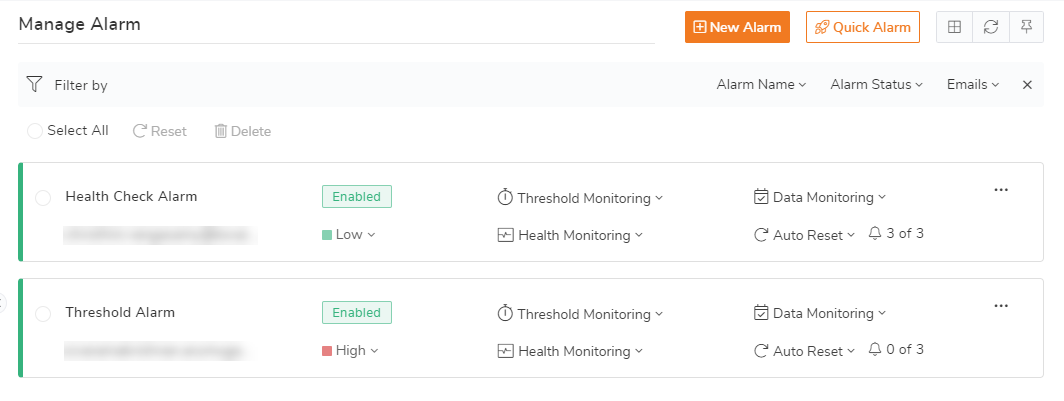
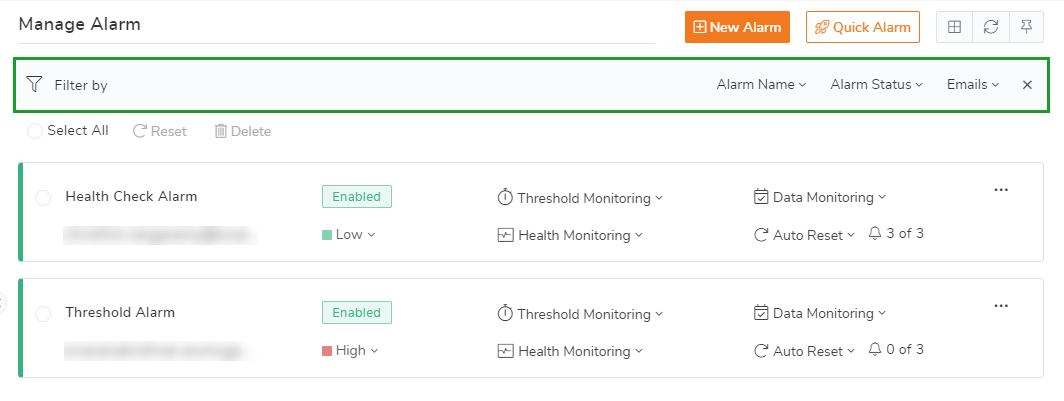
Card View
By default, the manage alarms page is set to Card view. In Card View, Alarm Name, Status of the alarm, Alarm types that configured, Email id's, Priority of the Alarm, Alarm persist duration, Alerts sent count and Auto-Reset properties are displayed in the view panel.
An advantage of the Card view is you can change make changes by selecting the feature, say example, to increase the Auto reset count select the drop-down of the Auto reset, change the count and save the value.
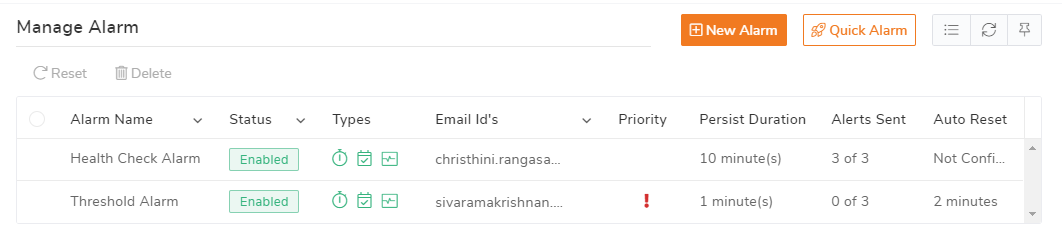
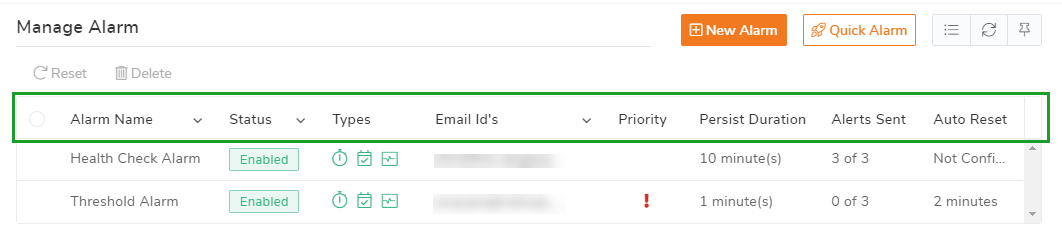
List View
By selecting the switch view you are allowed to change from Card view to List view. In List View, Alarm Name, Status of the alarm, Alarm types that configured, Email id's, Priority of the Alarm, Alarm persist duration, Alerts sent count and Auto-Reset properties are displayed in the grid.
Filters
The filters for the manage alarms are now changed dynamically according to the view/theme of the alarm that we have opted for.
When you select Card View, the filters will be available on the right corner of the view.
When you select List View, the filters will be available at the top within the List view.
Pin to Dashboard
Pin to Dashboard, functionality allows the user to pin the Manage alarms page to the dashboard of both Administration and Analytics. It will help us to easily redirect from the Monitoring/Analytics dashboard to the Manage alarms page.
1)Access policies for alarms - Superuser can define the access permission for alarm 2)Alarm Parallel execution - when you have more alarms configured the execution will happen parallel. with this you will get the alerts, the result in the dashboard, Autocorrection much faster compared with an older version.
Alarm User Access Policy
Superusers can define which alarm can be accessed by which level of users. Normal / NT group users can view the particular alarms and their details in Manage alarms, Dashboard, Group dashboard, Manage Mapping, Data monitoring, Notification History, and Governance & Audit sections only if they have access to that particular alarms. However, this is read-only, to manage the alarm or to create a new alarm user must have access to 'Manage Alarm'.
Say for instance if the normal user has access to Alarm 1 and Alarm 2, they can only view the mappings and status of the alarm in the dashboard and other areas but they can't manage that alarms. To edit or delete the alarms Alarm 1 and Alarm 2 normal user must have access to 'Manage Alarm'.
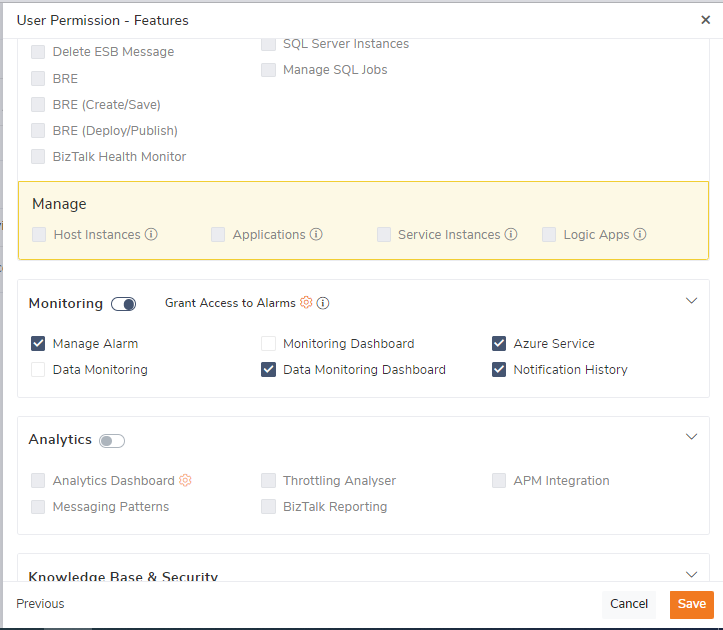
Note - To access any of the monitoring features user must have access to the manage alarm section or at least any one of the alarms.
Map the Escalation policy to Alarm
Escalation policy can be created under environment settings. Follow this article to create an Escalation Policy https://docs.biztalk360.com/docs/escalation-policies.
After adding the Escalation policy, you can associate it with an alarm.
- To link the policy with an alarm, go to the alarm configuration page and select the alarm.
- In the selected Alarm configuration, under notification settings select the "Threshold Notification Type" type as Escalation and choose the policy created.
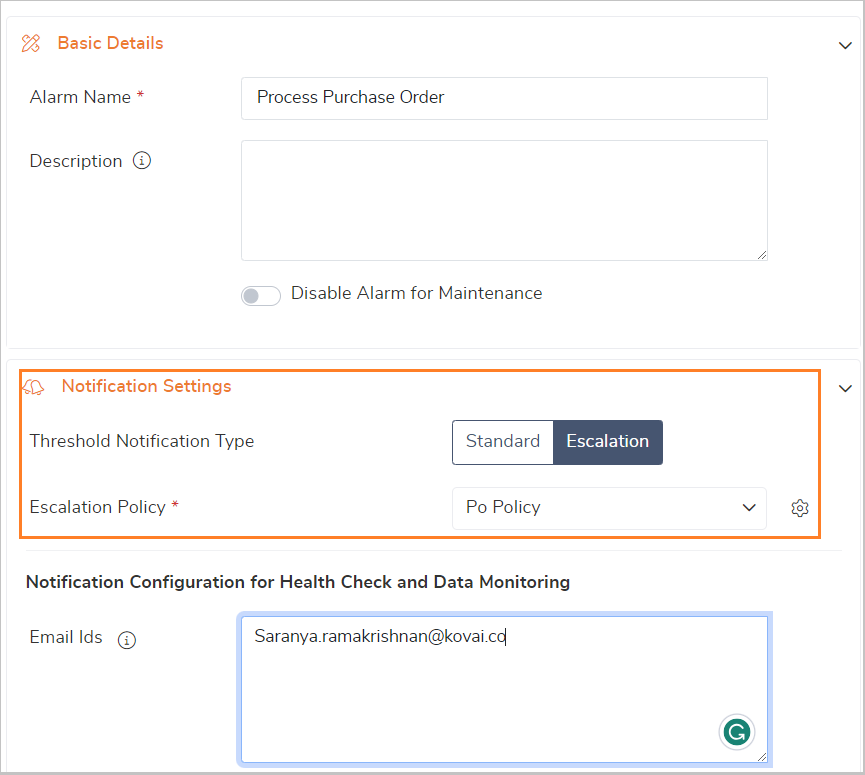
- The Escalation Policy is applicable only for Threshold notifications.
- The first escalation alert will be triggered based on the "Violation persist duration time " in the Threshold alarm configuration. i.e. if the violation persists duration is set to 10 minutes, then only after 10 minutes the alert will be triggered to Level 1