- 15 Jun 2023
- 10 Minutes to read
- Print
- DarkLight
- PDF
Web Endpoints
- Updated on 15 Jun 2023
- 10 Minutes to read
- Print
- DarkLight
- PDF
Follow the steps as shown below to monitor the health of the Web Endpoints. Besides, entering the basic details, the following is discussed in this article:
- Provide Authorization details, Proxy Settings, XML/JSON Payload, and Custom HTTP Headers
- Response Alert configuration
Setting up Monitoring for HTTP Web Endpoints
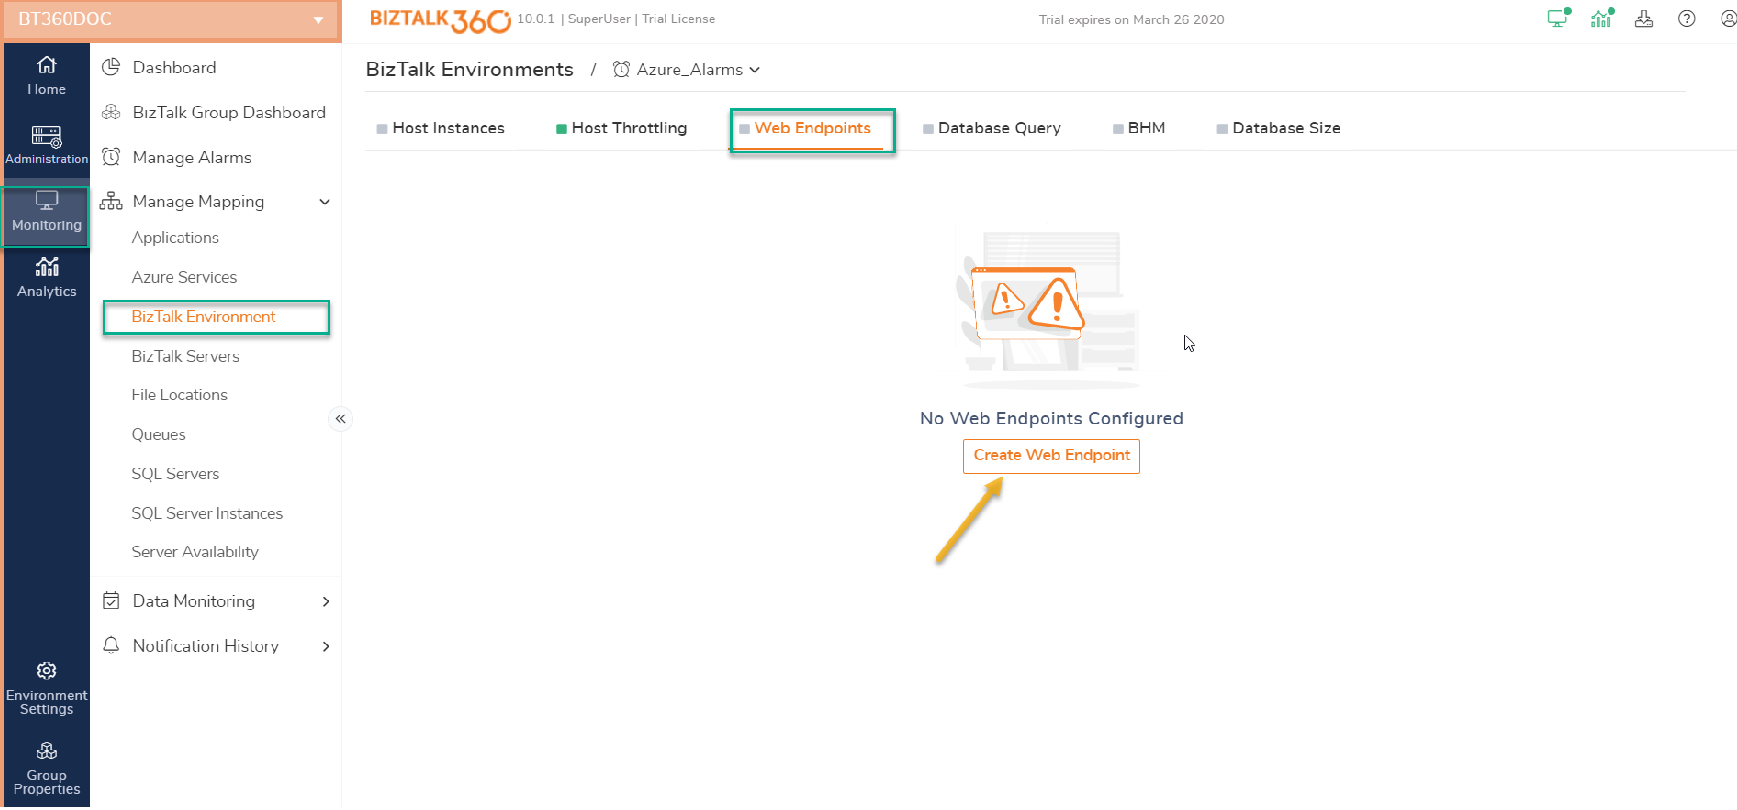
- Log in to the BizTalk360 application
- Click 'Monitoring' in the environment panel
- Click the expand button against the 'Manage Mapping' tab and click the 'BizTalk Environment' link
- Select the Alarm name (see Manage Alarms) from the drop-down, with which you would like to associate the Web Endpoint. At the tab pages at the top, select Web Endpoints. Click the Create Web Endpoint button to set up monitoring for the web endpoints

- Enter a 'Friendly name' for the web endpoint to be monitored, and the 'Endpoint URL' that you wish to monitor
- Toggle the 'Enable Endpoint for monitoring' option to start monitoring the configured Endpoint
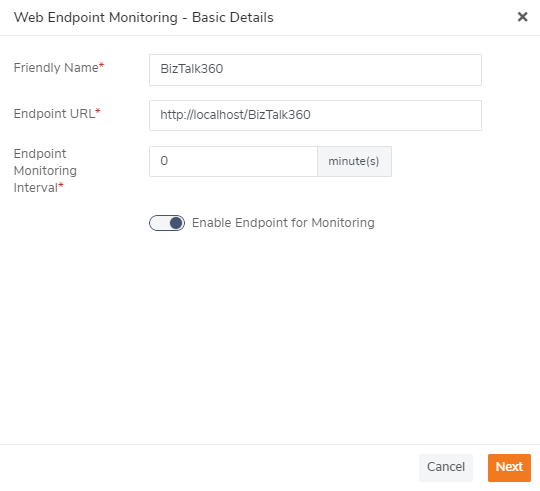
7. Configure the 'Endpoint Monitoring Interval', this will help to customize the monitoring polling interval for an individual endpoint. Based on the set interval, the BizTalk360 monitoring service will collect the current status of the web endpoint. By default, the Endpoint monitoring Interval will be the same as configured in the Global Polling Interval. Once the value is changed, then it will override the global configuration for monitoring. Monitoring polling Interval can be set from 1 min to 60 mins.
For Instance, Consider, there are two endpoints configured for Monitoring in BizTalk360. And you want to check the status of both the endpoints in different polling intervals. Say 1 in every 15 mins, other in every 30 mins. The monitoring service will hit the web service and collect the current status as per the polling interval configuration.
8. Click 'Next' to navigate to the next section
Provide Authorization details, Proxy Settings, XML/JSON Payload, and Custom HTTP Headers
In this section, we will take a detailed look at the optional settings that are available in the second screen that is displayed when configuring a new web endpoint monitor. All the details on this page are optional. You can choose to skip them if they are not required. You can set up the response alert configuration (based on return code or keyword) accordingly
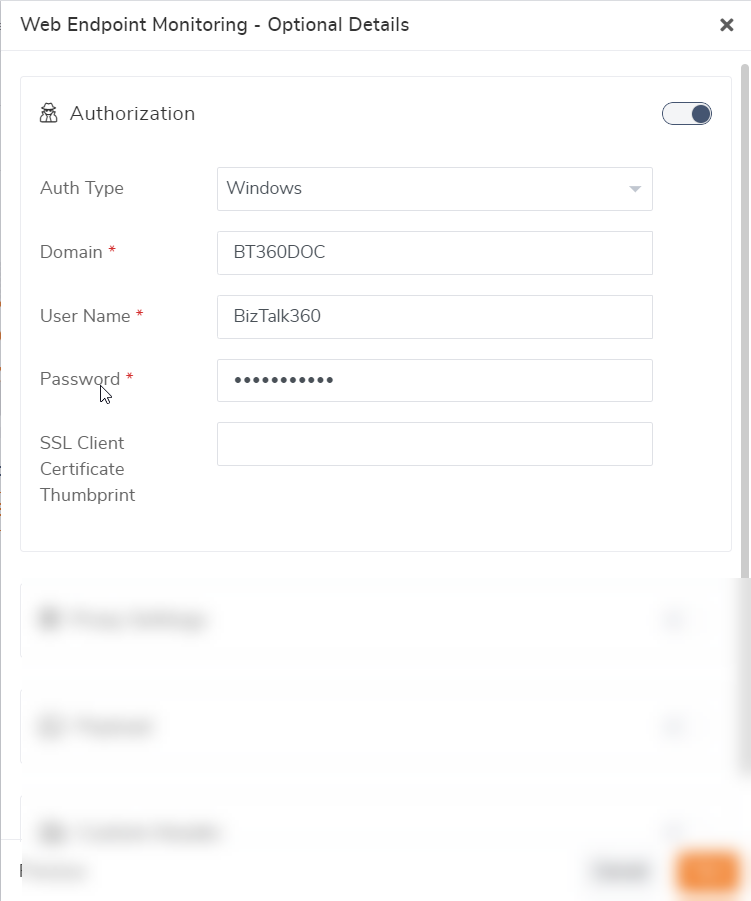
- Authorization Credentials- Web Endpoint monitoring supports the following types of authentication:
- Windows
- Basic
- Azure
Both Windows and Basic Authentication require Domain Name, User Name, and Password to authenticate the Web Endpoints. For monitoring HTTP web endpoints with SSL certificate settings, the Client Certificate Thumbprint is provided along with the User Name and Password. Azure services authentication uses ClientID, Client Secret, and Tenant fields (subscription can be independently recovered from your Azure account details) to generate an authorization token. The generated bearer token can be used to authenticate at the Web Endpoint. For these cases, you can specify the authorization credentials information. Example: Let's say you have a virtual machine that has BizTalk360 installed. You can easily check if the machine is running or not by setting up an endpoint monitoring on the http:///BizTalk360 URL. You can also specify the domain name, user name, and password to directly monitor the above URL. If the response is successful, you will see the endpoint health status as Healthy. If the endpoint is unavailable, the endpoint health status will be shown as Error and you will see an exception message as follows "Accessing the Web Endpoint " Test VM " returned an error. Cannot Validate Endpoint. Please verify internet connectivity".
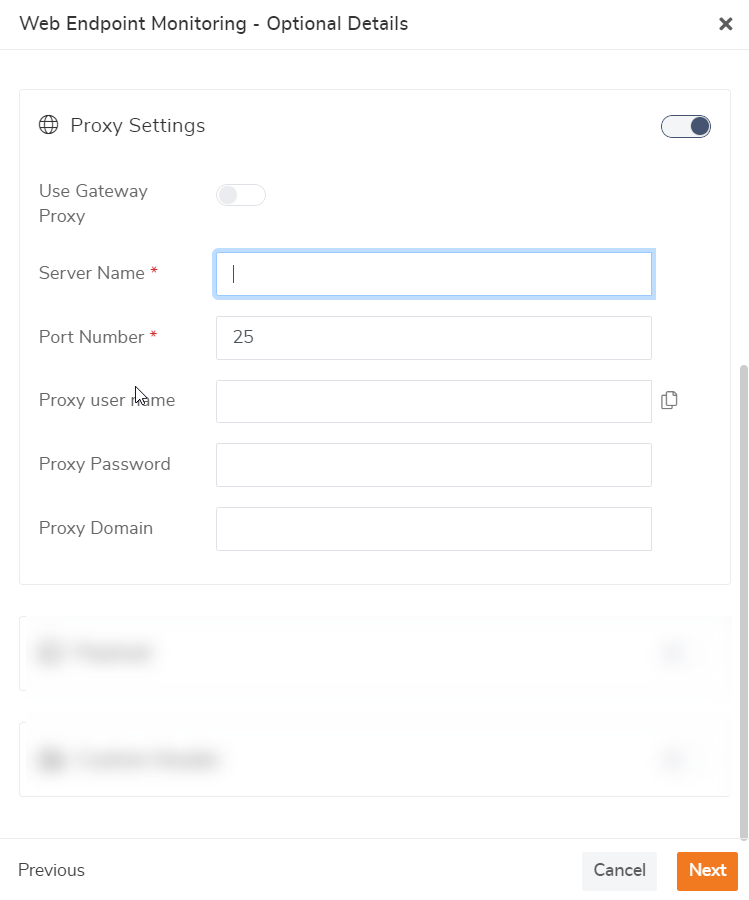
- Proxy Settings - If your organization uses a proxy, you can enter the proxy settings that are required to access an endpoint URL. There are two ways in which you can use Proxy settings in BizTalk360. The proxy settings can be predefined in the Gateway Settings page under BizTalk360 Settings. If the proxy settings are defined under the Gateway Settings page, then you need not enter the details in this section. You can simply toggle the Use Gateway Proxytoggle button to use the defined proxy settings. You can override the global gateway settings by entering the following information:
- Server Name - The name of your proxy server
- Port Number - The port number used to connect through your proxy
- Proxy username - The username to connect to the proxy server
- Proxy password - The password to authenticate the credentials to connect to the proxy server
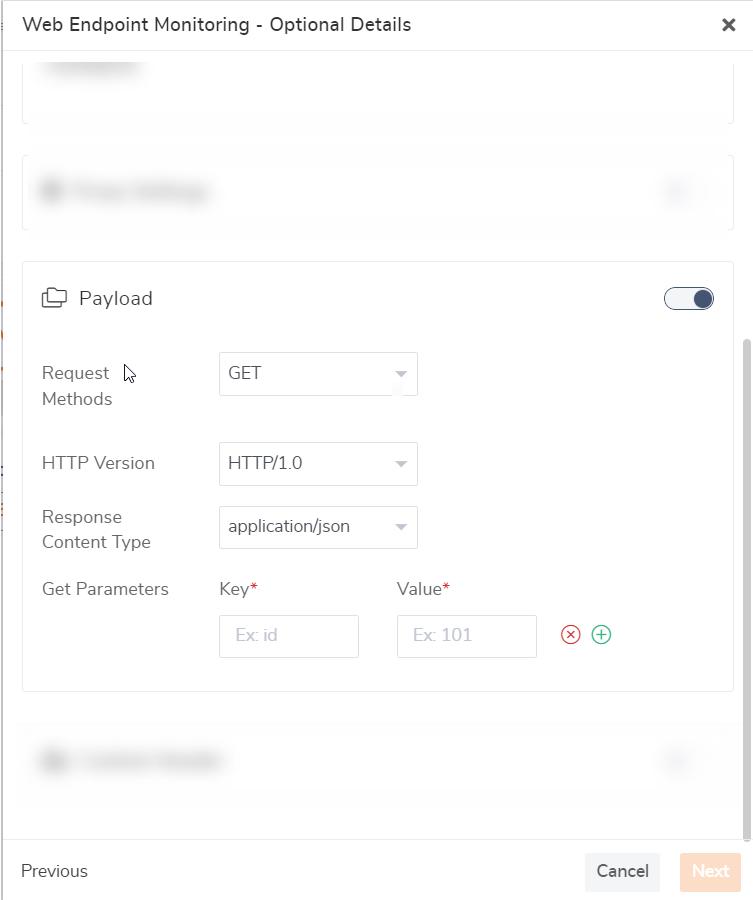
Payload - The payload section is used to configure the query string parameters of a GET request or content for a POST request. For example, let's assume you want to retrieve the list of send ports in a particular application "Contoso". You can use the BizTalk360 API (Services. REST/BizTalkApplicationService.svc/GetSendPorts) to retrieve this information. But this will not work without adding a few extra parameters like environment ID and application name. You can add these additional parameters required by the API in the Payload section and monitor this web endpoint. The payload section has the following options that users can choose to monitor their preferred endpoint.
Request Methods - Users can choose between GET or POST. Depending on the selection, you will see the following options
GET
- HTTP Version - Choose the version of HTTP (HTTP/1.1 or HTTP/1.0)
- Accept - The accepted content format such as application/json, application/xml,application/soap+xml, text/html, text/xml, application/javascript, text/plain,Other Content Type (application/EDI-X12)
- Get Parameters - The two fields (Key and Value) have to be passed along with the endpoint URL. For example, the environment ID, application name, etc as mentioned above. Enter the values in the space provided. You can add multiple parameters by clicking the + button. Click the Delete icon to delete the parameter
- POST
- Add content length - Toggle the icon to add the content length to the endpoint URL
- HTTP Version - Choose the version of HTTP (HTTP/1.1 or HTTP/1.0)
- Accept - The accepted content format such as application/json, application/xml,application/soap+xml, text/html, text/xml, application/javascript, text/plain, Other Content Type
- Content-Type - The content type format such as application/json, application/xml, application/soap+xml,text/html, text/xml, application/javascript, text/plain, Other Content Type
- Payload - The payload to be added to the endpoint URL
- Custom Header - You can pass custom headers along with your endpoint URL. You need to pass the Custom Header Name and Custom Header Value for the custom headers. You can add multiple custom header values as required by clicking the + button
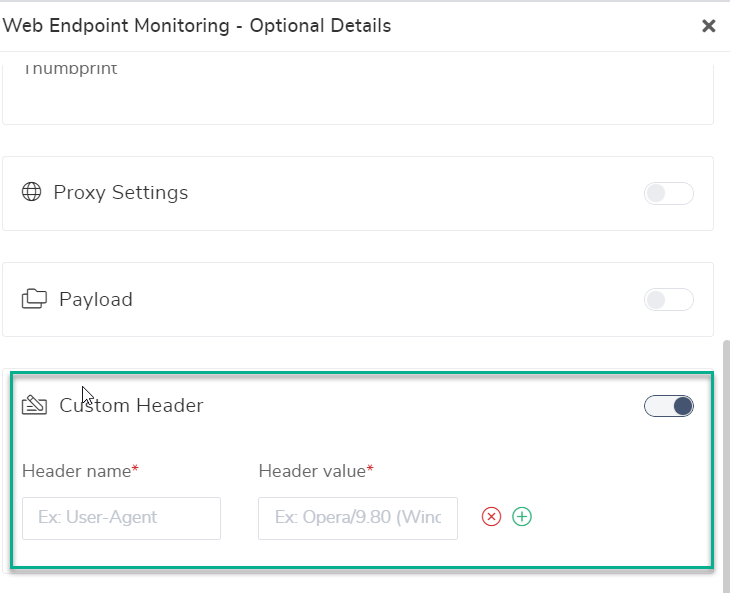
- Click 'Next' to navigate to the Response Alert configuration screen
Response Alert configuration
In this section, we will take a detailed look at the different options that are available on the third screen that is displayed when configuring a new web endpoint monitor.
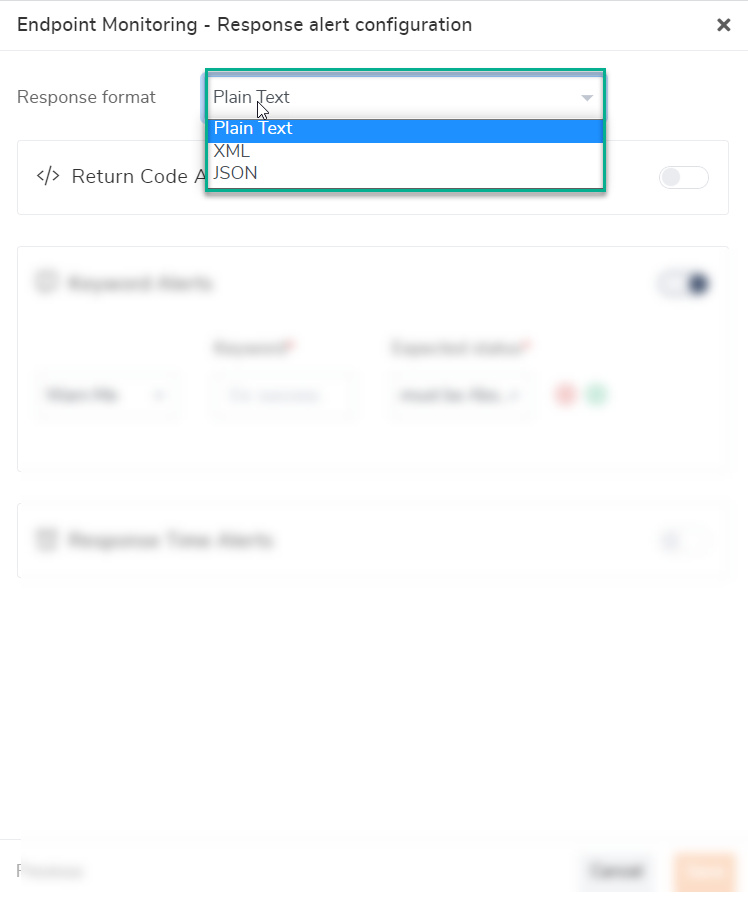
- Response Format - You need to select the type of response format that you will receive when the monitoring service tries to access the web endpoint. The different options available are - Plain Text, XML, and JSON
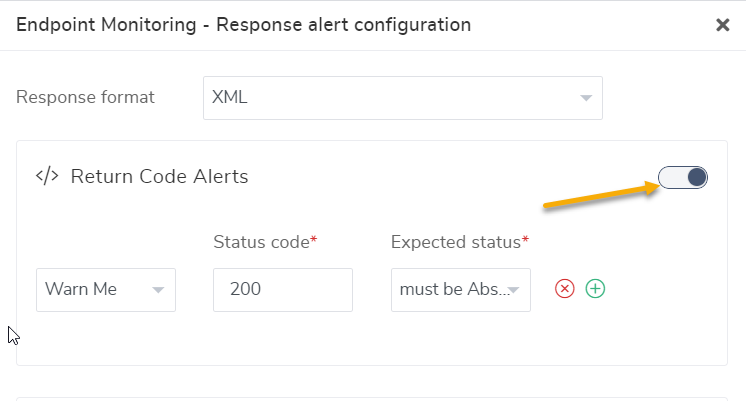
- Return Code Alerts - You can set up monitoring for the web endpoint and set up alerts based on the return code that is generated by the endpoint. You can define monitoring such as 'Set up a monitor on https://www.microsoft.com and the status should be Healthy if the return code is 200. Otherwise, throw a warning/error and set the status appropriately.' To achieve this, you need to define 3 parameters:
- Status Code - This is the return code that you expect from the endpoint if it is active
- Expected Status - This expected status of the return code in the response alert. You can choose between Must be Present and Must be Absent
- Else - This section will get triggered when the logic fails for the expected status value. For instance, if you set the expected status code (200) to "Must be Present", and the actual return code from the web endpoint is 404, then in this case the else section will get executed and the health status of the web endpoint will be displayed as Error or Warning depending on the value selected.
_JSON Path Alerts / _XPath Alerts - Similar to return code alerts, you can set up monitoring and set the alert configuration to the _JSON Path and _XPath Alerts. You need to define the following 3 parameters:
- XPath / JSON Path - Enter the XPath/JSON Path in the space provided. You can find an example given in the text box. You need to enter the path in the specified format only. For example, in JSON Path, you can enter the JSON path as $.breakfast_menu.food[0].price and in XPath, you can enter the XPath as /breakfast_menu/food[1]/price
- Expected value - Enter the expected value that the XPath/JSON Path will return. If the actual value returned is the same as the expected value, you will notice the endpoint health status to be Healthy. However, if the returned value is different from the expected value, the endpoint health status will be displayed as Error or Warning depending on the status defined in the else section.
- Else - This section will get triggered when the logic fails for the expected value status. For instance, if you set the expected value of $.breakfast_menu.food[1].price (or) /breakfast_menu/food[1]/price to $7.95, and the actual value returned by the XPath or JSON path is $5.95, then the else section will get executed and the health status of the web endpoint will be displayed as Error or Warning, depending on the selected value
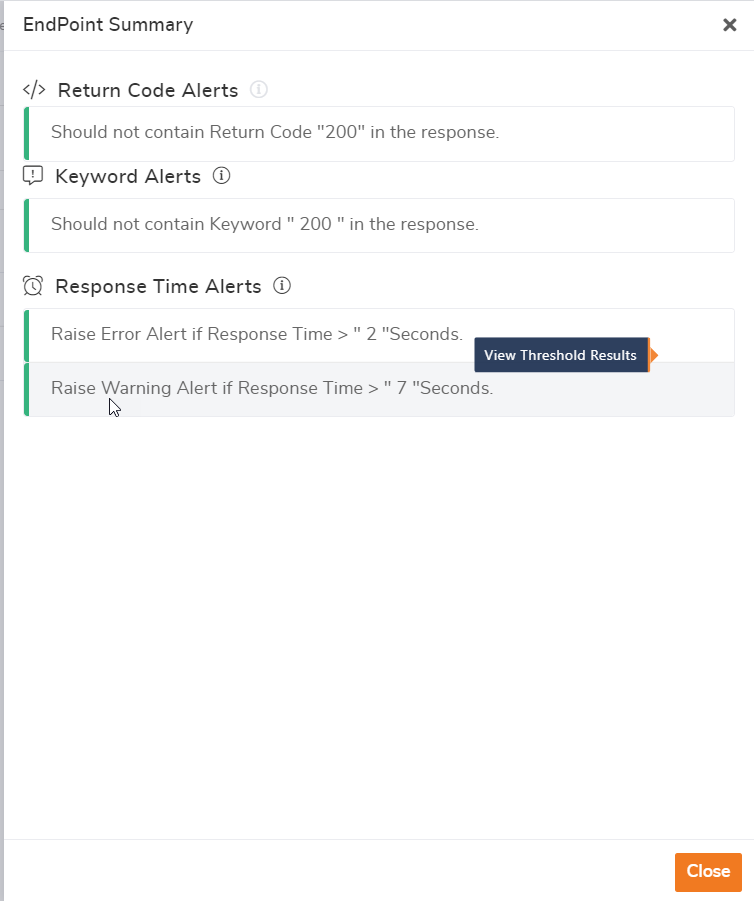
- Response Time Alerts - You can set up monitoring for the web endpoint based on the response time alert. You can specify the warning and error time by which the endpoint should send a response back. If the time exceeds the time, the endpoint will be shown in either the Warning or Error state. The default warning time is 2 seconds, and the error time is 7 seconds.
- Click 'OK' to start monitoring the endpoint
Note: Web Endpoint Monitoring is able to monitor endpoints when TLS version 1.0 security protocol is disabled.
Azure Endpoint Monitoring
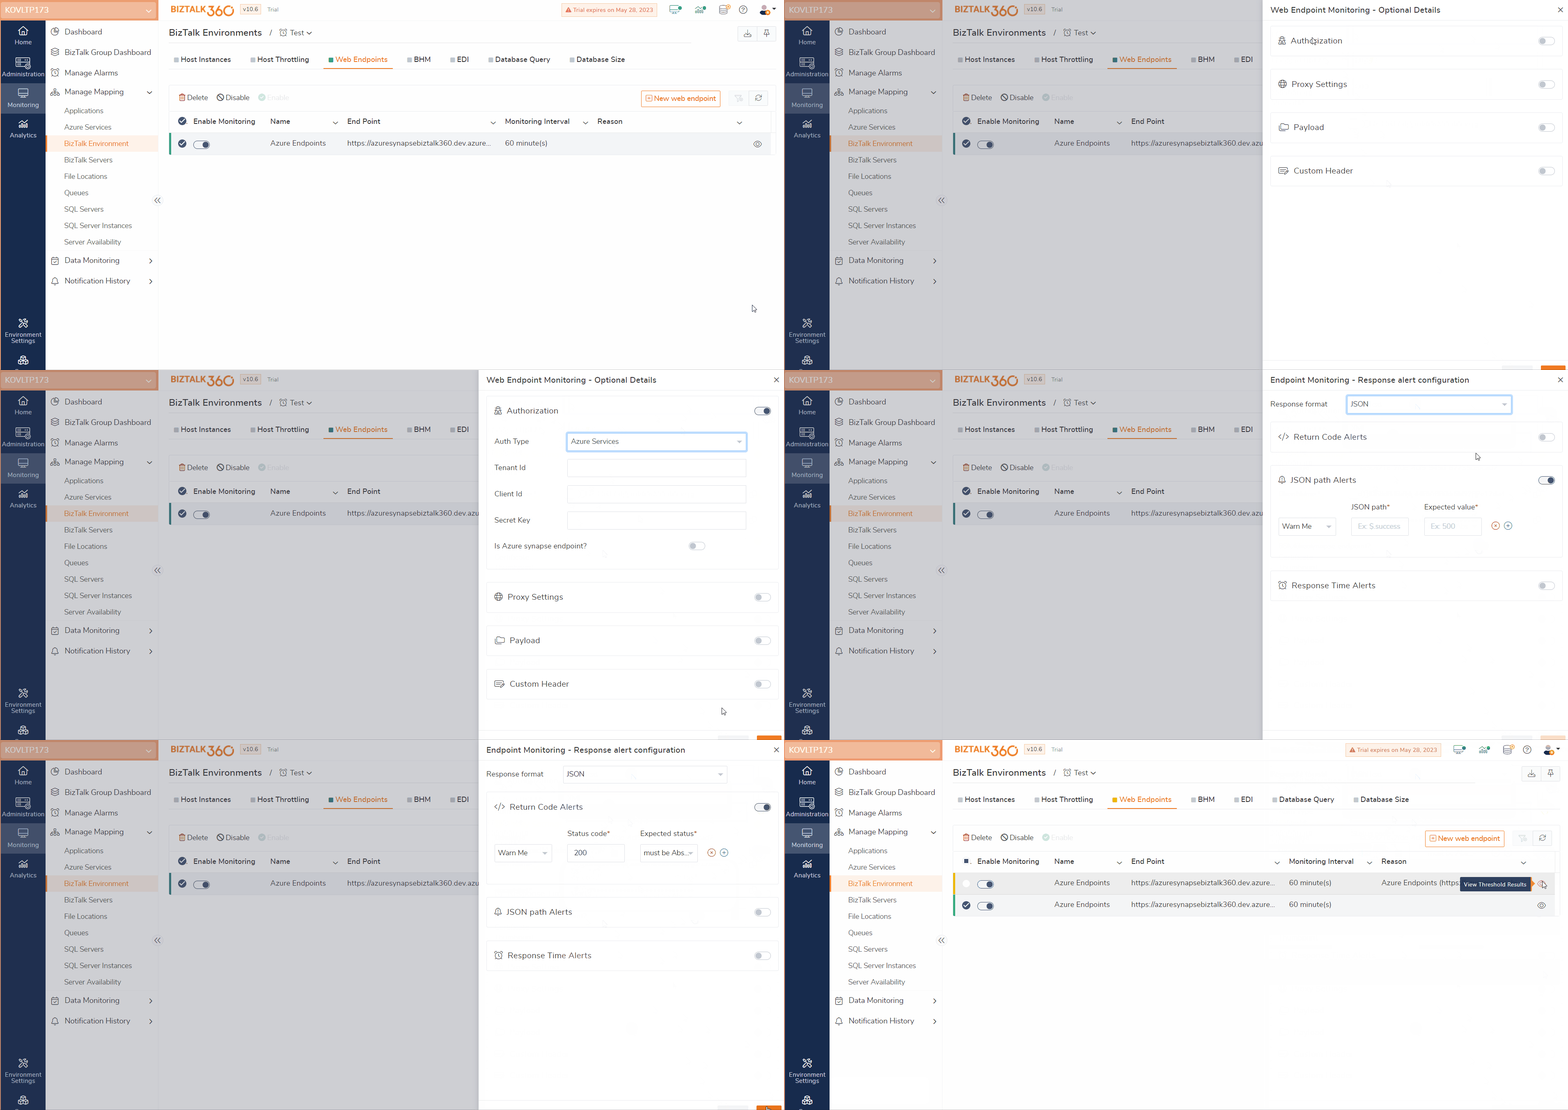
- To Monitor the Azure Endpoints, Provide the Endpoint URL and Choose the "Enable Endpoint for Monitoring" toggle and click Next.
- In the next page, Enable the Authorization toggle and choose the Auth type as "Azure Services". Then, provide the Tenant_ID, Client_ID and Secret Key.
- If you want to monitor the Azure synapse Endpoint, choose the authorization type as "Azure Services" and enable Azure Synapse Endpoint and click Next.
- Provide the necessary details in the response alert configuration and save the Configuration.

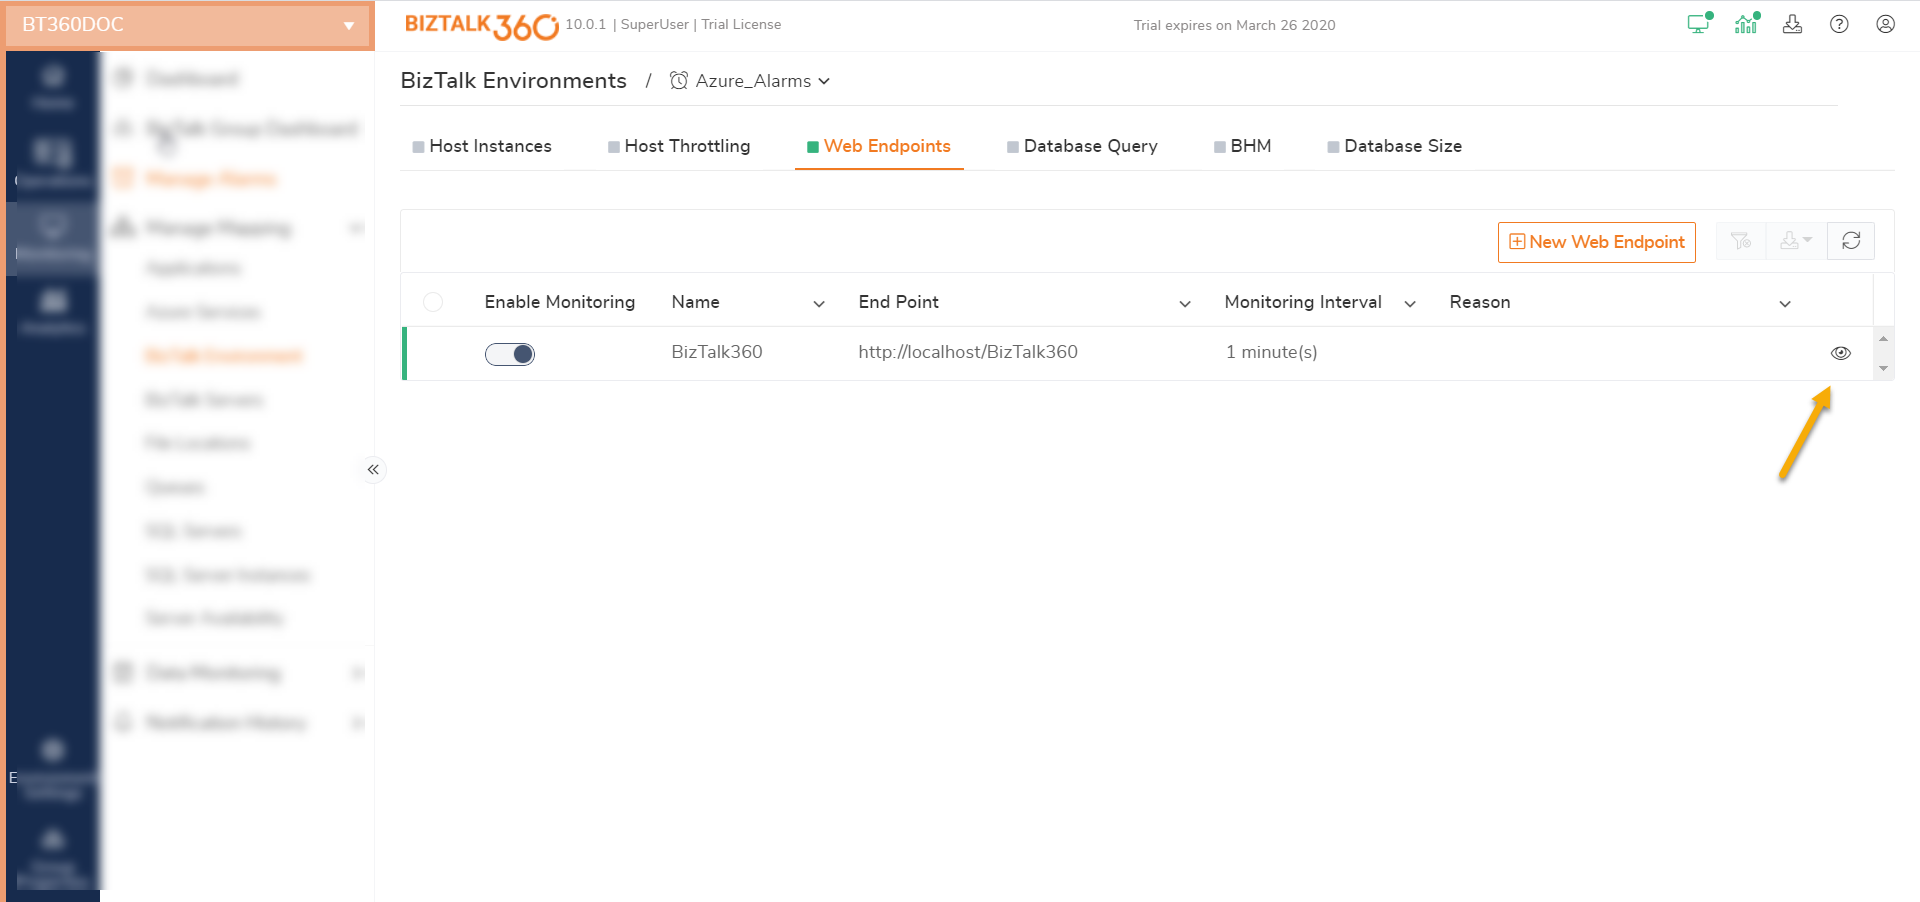
Endpoint Summary
Depending on the endpoint configuration, you will see the current status of the endpoint monitor as either Error, Warning, or Healthy. In case, of the Warning or Error status, the Reason field will display the reason for the current status. Click the eye icon in the Summary column to view the endpoint summary information.
