Report History
- 23 Apr 2024
- 1 Minute to read
- Print
- DarkLight
- PDF
Report History
- Updated on 23 Apr 2024
- 1 Minute to read
- Print
- DarkLight
- PDF
Article Summary
Share feedback
Thanks for sharing your feedback!
Based on the report settings, BizTalk360 will trigger the reports to the users through email \ Notification channel \ and Save them in the archive location with the PDF attachment of the dashboard.
To view the Report Notification History,
- Log in to BizTalk360.
- Select the Reports section from the environmental panel.
- In the Reports section select Report History. You will see the list of reports history that have been triggered by the application.
- Transmission Status -
- The Red patch on the left side of each report denotes that the report is not transmitted due to SMTP\gateway configuration issues.
- The green patch denotes that the report is successfully transmitted.
- Report Name - This column displays the name of the report configured.
- Dashboard/Query Name - This column will have the name of the mapped dashboard \ Query name.
- Dashboard/Secure SQL query - This column shows that the report is mapped with Dashboard or Secure SQL query.
- Frequency - This Column shows the schedule frequency configured in the report.
- Is report saved locally - A tick will be shown when the report is enabled to save locally.
- Sent time - The time of report execution used to display under this column.

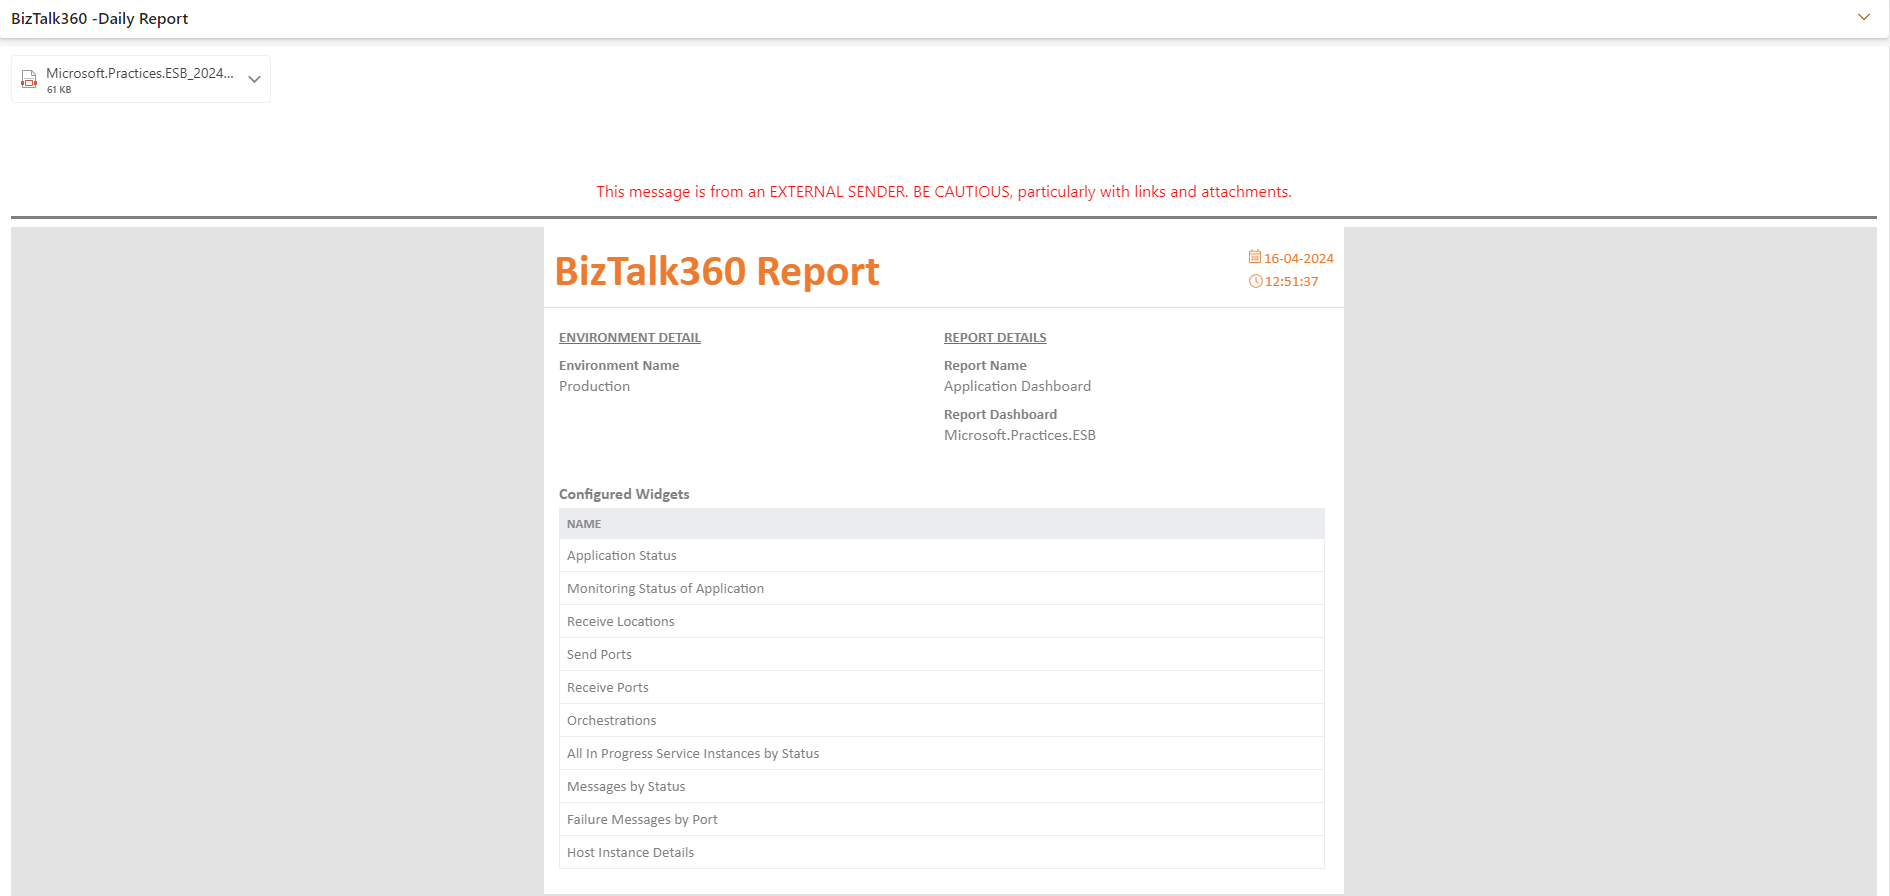
Email Notifications
Once the reporting schedule executes, the email recipient will receive the email from BizTalk360 with the PDF attachment of the report.
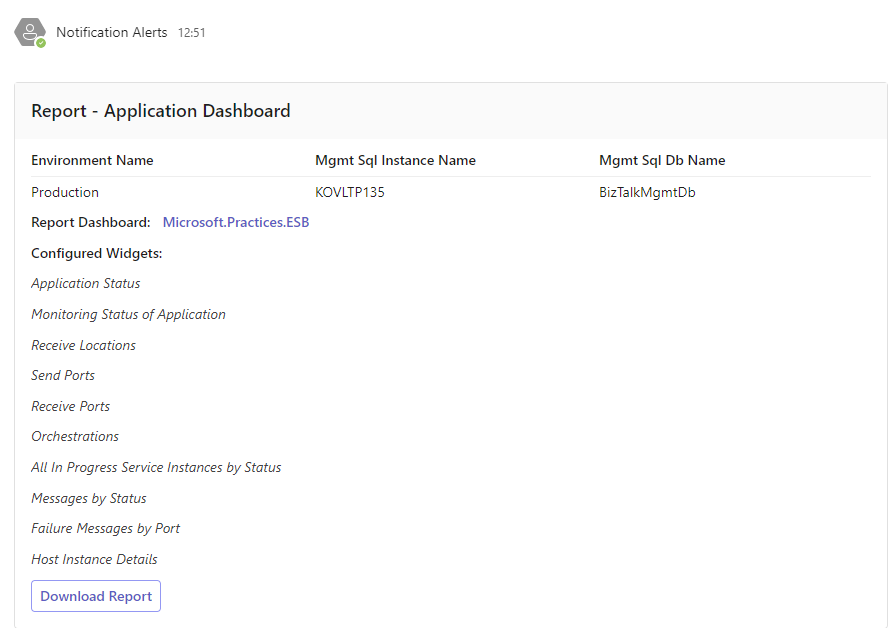
Channel Notifications
Once the reporting schedule executes, the configured channel will receive the alert from BizTalk360 with the PDF attachment of the report.
Was this article helpful?