System Resources
- 25 Apr 2024
- 5 Minutes to read
- Print
- DarkLight
- PDF
System Resources
- Updated on 25 Apr 2024
- 5 Minutes to read
- Print
- DarkLight
- PDF
Article Summary
Share feedback
Thanks for sharing your feedback!
SQL system resources is critical for ensuring the stability, performance, and security of SQL Server environments, and it directly contributes to the success and competitiveness of businesses relying on SQL databases for their operations.
Monitoring SQL system resources is essential for ensuring optimal performance, identifying potential issues, and maintaining the reliability of database operations. This article will show how to set up monitoring of the system resources. The resources monitored under this section are CPU and Memory usage of the SQL server(s).
Monitor System Resources via BizTalk360
To monitor SQL System Resources, users first need to add the respective SQL Server in their BizTalk360 Environment. Look into this article to Add SQL Server in BizTalk360 Environment. Once this is done, users can proceed to monitor the various components of the SQL Server.
- Monitoring CPU usage helps administrators understand how much processing power SQL Server is consuming. High CPU usage may indicate heavy query processing, inefficient queries, or resource contention. Monitoring CPU utilization allows for proactive identification and resolution of performance constraints.
- Monitoring Memory usage is crucial for ensuring SQL Server has sufficient memory to cache data, execute queries, and maintain system stability. Memory-related issues, such as excessive paging or memory pressure, can impact database performance. By monitoring memory usage, administrators can optimize memory allocation and prevent out-of-memory errors.
Setting up monitoring for System Resources
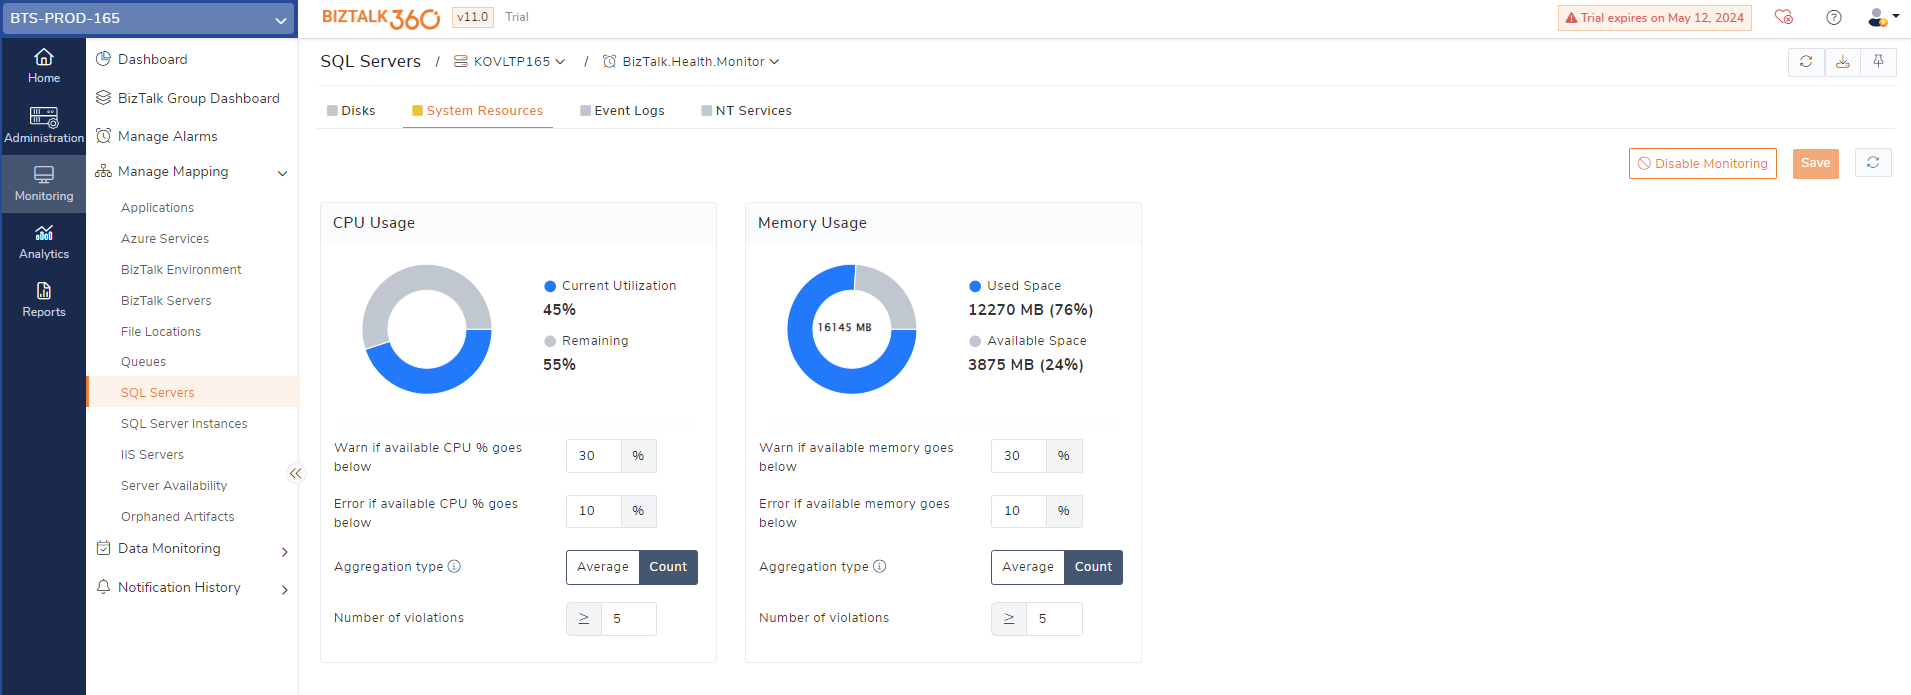
BizTalk360 automatically retrieves the current CPU and Memory usage of the configured SQL server(s). By following below steps, you can configure BizTalk360, to alert you when the CPU and Memory go below the specified threshold percentages.
- Go to Monitoring >>Manage Mapping >>SQL Servers >>System Resources.
- Select the SQL server from the drop-down for which you want to set up the monitoring.
- Choose the Alarm (see Manage Alarms) which you would like to associate the alerts.
- Click the 'Enable Monitoring' button to set up monitoring for the system resources. The current memory and CPU utilization count is listed in this section.
- By default, the warning threshold limit is set to less than 40% and the error is set to less than 20%. The default threshold limit can be modified according to your business usage.
- Aggregation type - This option defines how monitoring should happen, whether based on the average value calculated during the last cycle or based on the count of threshold violations that occurred during the last cycle.
- Click 'Save' to save the threshold information.
- At any point, to stop monitoring, click the 'Disable Monitoring' button.
Aggregation type - What is it & how it works?
Aggregation is the process of collecting CPU and Memory usage samples for the specified time period and consolidating the result according to the chosen aggregation type.
In the Environment Settings -> Monitoring -> Mapping Configuration -> Threshold tab, users can configure the number of usage samples to be collected per minute. By default, the Maximum Polls Per Minute is set to 15. This means that usage data is collected continuously for 15 seconds in a minute and that will be used for monitoring. If you want to monitor the resources usage for a longer period, you can increase this Maximum Polling limit.
BizTalk360 offers two types of Aggregation: Average and Count.
1. Average: It calculates the average of the usage samples collected over the specified duration and compares it against the configured threshold rules.
For e.g., suppose a user has set the Maximum Polls Per Minute to "20" and the Aggregation Type as "Average." In this case, the monitoring service will collect CPU and Memory Usage for 20 seconds during each cycle. For instance, if the current time is 11:30:00 AM, it will collect CPU and Memory usage from 11:30:00 AM to 11:30:20 AM, continuously for 20 seconds. The average of this 20-second usage data is then compared against the Warning and Error Thresholds.

In the above example,
- A Warning notification will be sent if the average CPU consumption goes below 30% or average available Memory goes below 30%.
- An Error notification will be sent if the average CPU consumption goes below 10% or average available Memory goes below 10%.
Users who typically prefer not to receive alerts for every short spike in a minute can choose the "Average" aggregation type. This option sends alerts only if spikes occur frequently.
2. Count: The number of violations occurred in the collected usage samples determine the monitor result.
For e.g. let's say a user has set the Maximum Polls Per Minute to "30" and the Aggregation Type as "Count". Hence the monitoring service will collect CPU and Memory Usage for 30 seconds during each cycle. For instance, if the current time is 11:30:00 AM, it will collect CPU and Memory usage from 11:30:00 AM to 11:30:30 AM, continuously for 30 seconds.
When the Aggregation type is set to Count, users will be prompted for another option: Number of Violations. This option defines how many violations will be considered as an error or warning. If the value is set to 5, an alert will be triggered if any 5 collected samples in the 30 seconds duration violate the threshold.
In the above example,
- A Warning notification will be sent if any 5 collected samples of CPU or Memory goes below 30%.
- An Error notification will be sent if any 5 collected samples of CPU or Memory goes below 10%.
Users who prefer to receive alerts even if there is massive deviation between spikes can choose the "Count" aggregation type. This option considers the frequency of occurrences instead of overall average.
What happens if the SQL Server is not reachable?
In SQL server system resources monitoring, if a particular server is not reachable, the system cannot monitor the CPU and memory usage. In such case, Server not available message will be shown to the users.
For a Clustered SQL Server, it will show the current active monitoring Node. It will automatically pick up the CPU usage and the memory for the currently active node. In the case of a Failover, the CPU and the memory will automatically get updated for the active node (failover node) with the existing warning and error conditions.
Windows Failover Clustering is a high-availability option which is designed to increase the uptime of SQL Server instances. A SQL Server cluster includes two or more physical servers, called nodes. One is identified as the active node, on which a SQL Server instance is running the production workload, and the other is a passive node, on which SQL Server is installed but not processing the workload. If the SQL Server instance on the active node fails, the passive node becomes the active node and begins to run the SQL Server production workload with some minimal failover downtime.
To collect system resources data, the alarm needs to run for a specified duration for each server (By default 15 seconds). To efficiently monitor multiple servers, it is recommended to set up separate alarms for each server's system resources. This helps avoid delays in receiving alerts.
Was this article helpful?