In troubleshooting events in BizTalk360, the error message often serves as the initial clue to determine the root causes. BizTalk360 logs play a vital role in diagnosing errors within the BizTalk360 application. By configuring the logs, the system gathers all the error messages, enabling you to review them along with their error description and timestamp. Monitoring these logs ensures the health of your environment, allowing you to proactively address any issues that may arise.
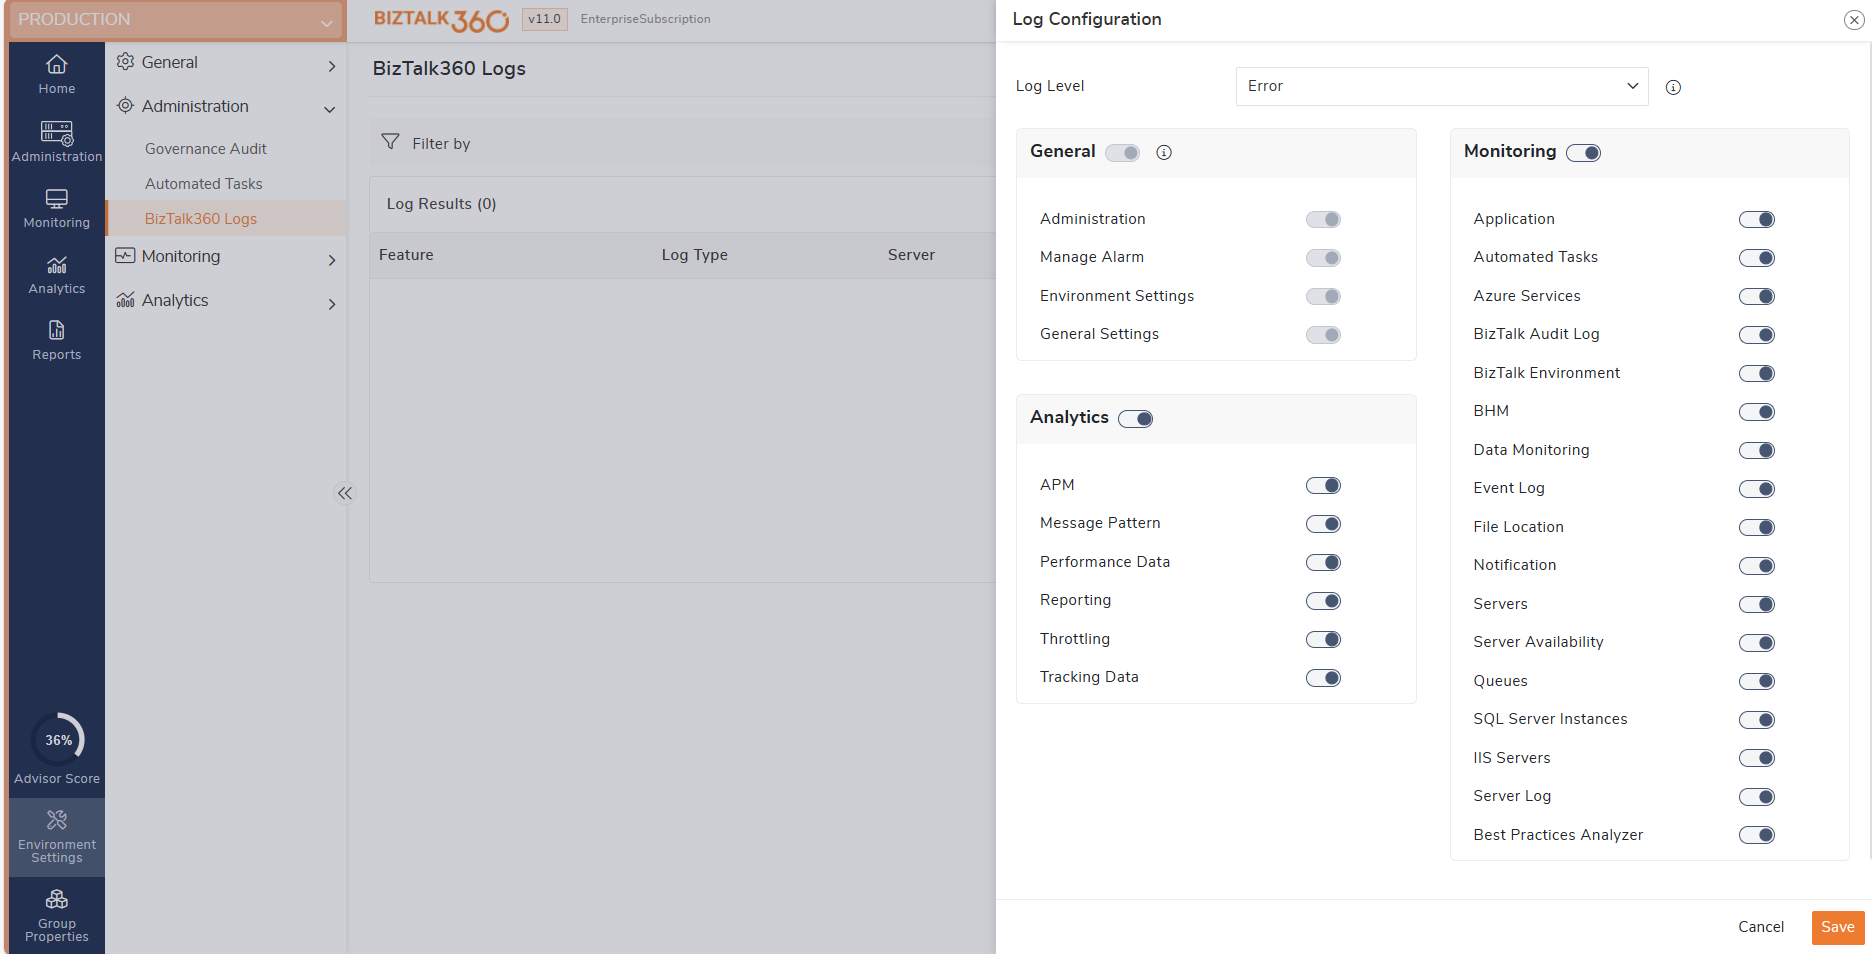
Log Configuration
To indicate which logs should be collected, certain configurations must be completed initially. For instance, if you heavily rely on the BizTalk360 monitoring feature and wish to focus on observing monitoring problems exclusively, you can enable logs specifically for collecting monitoring errors.
To access the log configuration in BizTalk360, follow these steps:
- Navigate to the Environment settings ->Administration->BizTalk360 logs
- Click on the "Log Configuration" button
- Once you are in the log configuration blade, you can make the following updates:
- Update the log level based on your requirements. You can choose from log levels such as Error, Fatal, Warning, Info, and Debug.
- Enable the desired feature lists to collect logs for the specified log levels.
Setting up BizTak360 Log Data Monitoring
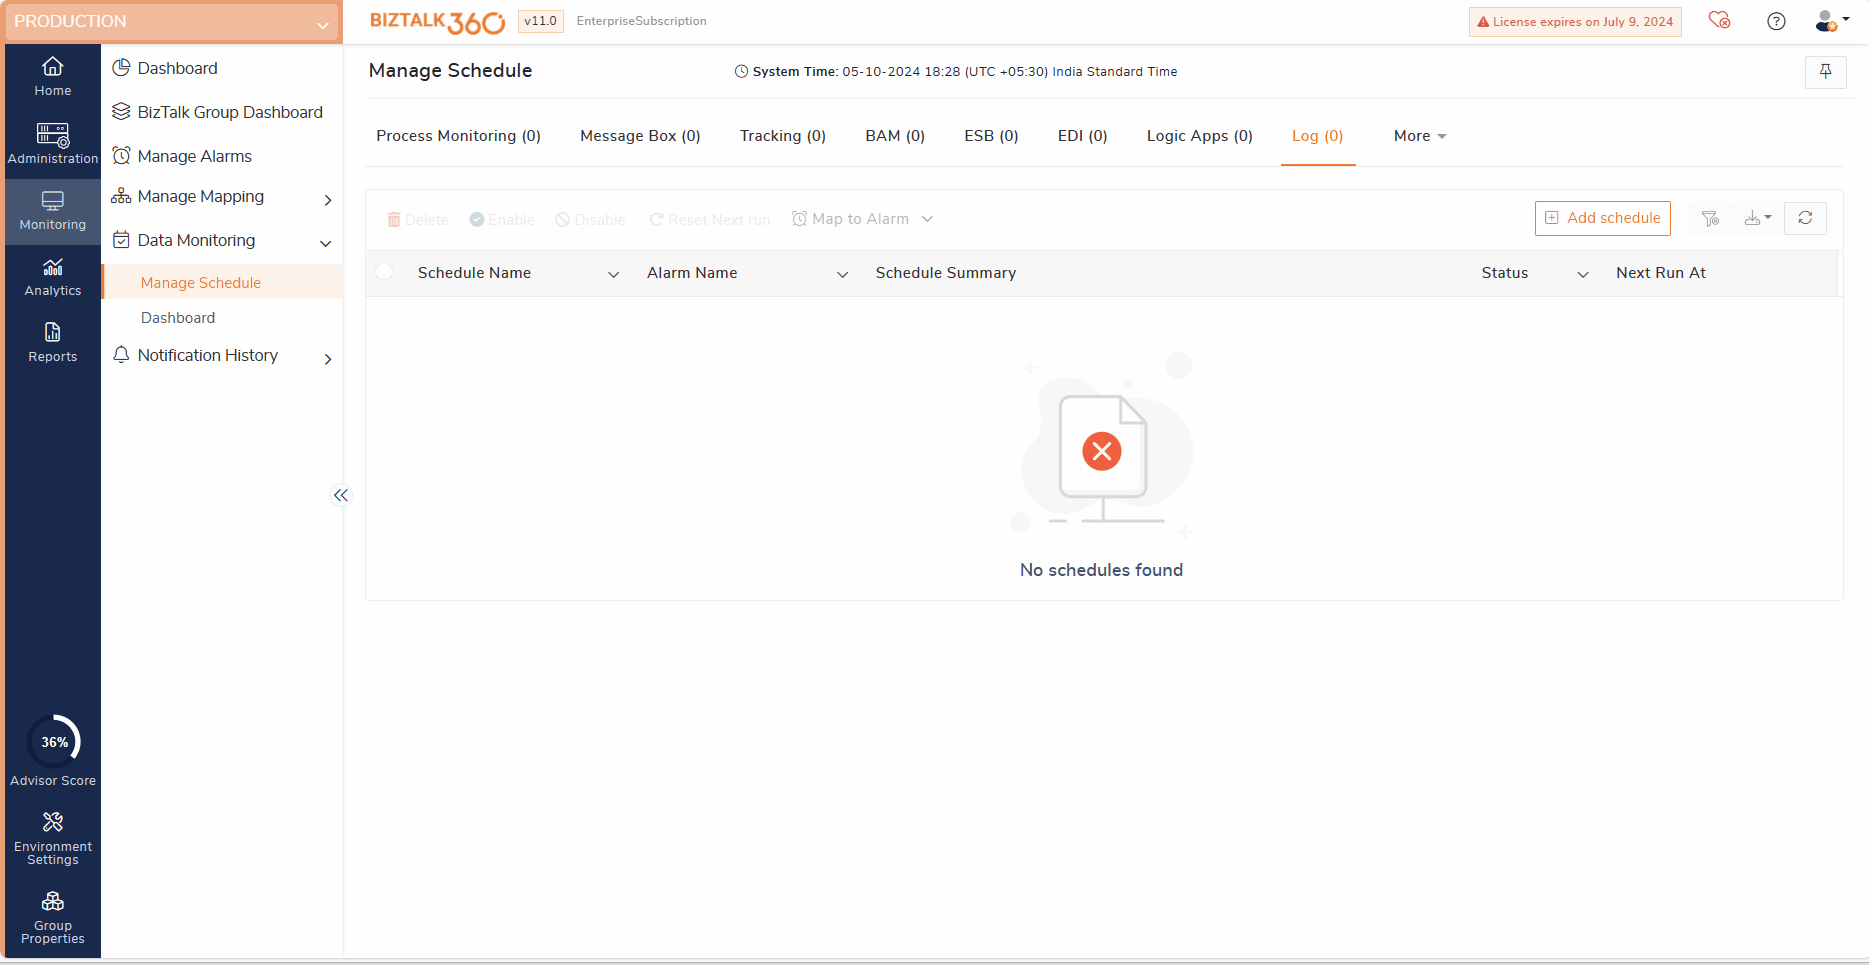
Go to Monitoring ->Data Monitoring ->Manage Schedule. In the Manage Schedule page select Log Monitoring and follow the below steps to configure the schedule to monitor BizTalk360 logs.
Let us consider a scenario to monitor BizTalk360 Monitoring Logs and send a report every 1 hour.
- Choose Alarm - The first step to set up BizTalk360 Log data monitoring is to create an alarm. Once you have created the alarm, the alarm name will be displayed in the schedule configuration drop-down. Select the alarm that should be used for BizTalk360 Log data monitoring. In case you did not do it earlier, follow the steps mentioned in this section to create a Data Monitoring alarm
- Schedule Name - Provide a meaningful name for the Log monitor.
- Enable the monitoring schedule. you can disable this to stop monitoring.
- Set Data Filter
- Select type as BizTalk360 Log
- Log Server - Select the server that needs to be monitored
- Log Type - Select the Log Type level as Fatal, Error, Warning
- Features - Choose BizTalk360 features in which you wish to monitor the logs. To look only at Monitoring Logs, select monitoring features.
- Match Condition -This option needs to be selected for the filter options that are selected in the above fields. By default, the value of this field is "All". ALL works as And condition which checks for all the conditions to be true, ANY works as OR condition which checks for anyone condition to be true.
- In Addition, you can filter with log Descriptions and Exception by adding multiple conditions
- How do you want to check - Choose whether you want to monitor all the logs from the beginning or only the past few days of logs based on the error logged time.
- Set the Threshold Condition
- Configure error and warning threshold limit values
- Send Event Log Details- Enable this to receive the log details as an attachment in the mail
- Monitoring Schedule
- Frequency (How often you want to monitor) -Select Daily to monitor the daily activities of the environment and send the log details at the end of the day
- When during the day - Select when the data monitor must execute on a particular day during business hours. You can customize your business hours by selecting the values from the Business Day Start and Business Day End options.
- At what time? -
- End Of the Business Day - For e.g. if the business end time specified is 5 PM (default value), the data monitor will execute at 5 PM and send an alert at 5 PM.
- Frequency - Select the number of minutes/hours after which the data monitor should execute. E.g., For 1 hour means the data monitor will run once every 1 hour
- Start Date / End Date - When you want to start/stop the scheduled execution. If you want the schedule to execute all the time, choose No end date.
8. Summary - The summary information will automatically be listed based on the information selected in the previous steps. Click the Save button to store the schedule configuration.
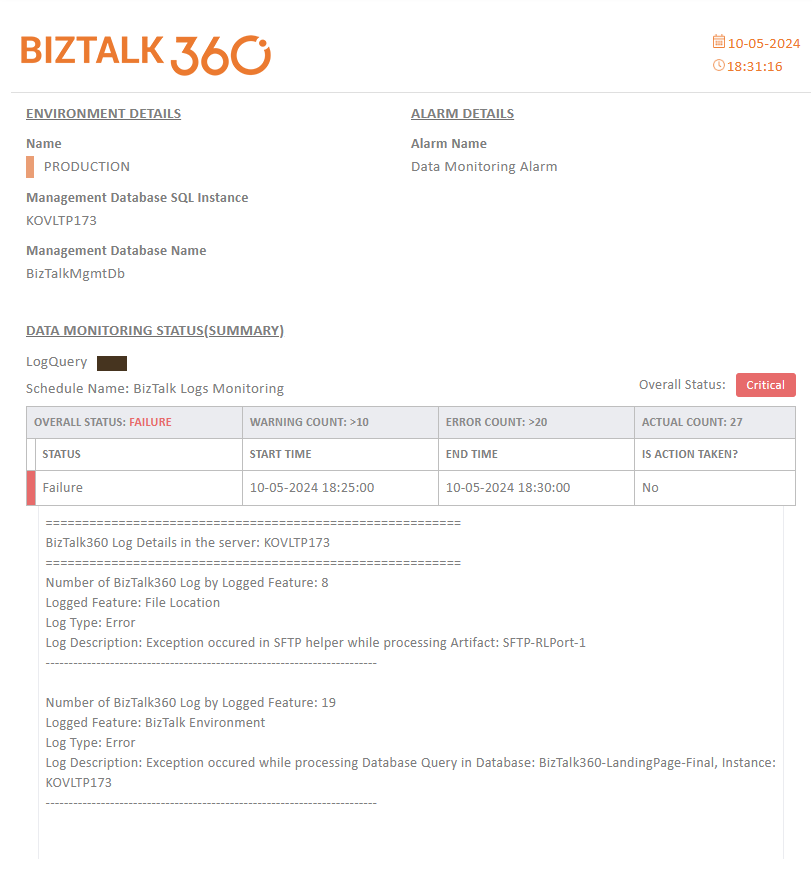
Data Monitoring Execution Results
Once the schedules are created, it will get executed on the specified time frame. Once after the execution of schedules, it will be displayed in the data monitoring dashboard. You can go to the data monitoring dashboard and click on the respective schedule to view the data monitoring schedule execution results.
Once the BizTalk Logs Data Monitor is created and configured, it will execute during the specified time intervals. The Data Monitoring dashboard will display the status of the BizTalk Logs Data monitor on a specific date at a specific time interval in the calendar chart control.
Based upon how you configured your Data Monitoring alarm, emails might get triggered to the email id(s) which are specified while creating that Data Monitoring alarm.
The email alert(s) will contain the BizTalk Logs Data Monitor Execution Results of the data monitor. By default, if you only selected the 'Use this alarm for Process Monitor Alerts' option, you will only receive the Failure emails to the configured email address(es). Alternatively, if you also selected the 'Notify on Success as well' option, you will receive the success alert emails as well to your mailbox. The following screenshot depicts a successful email notification received for a configured BizTalk Logs Data monitor.