Most of the BizTalk server environments comprises of multiple servers, say, two BizTalk servers and two SQL servers to support high availability. With this kind of setup in place, it is important for the administrators to know the topology of their environment. In practice, administration teams create the BizTalk environment topology diagram using Visio or MS Word and store it in a repository like SharePoint. Depending on the organization size, there will be different environments like SIT, UAT, Staging, Performance, and Production, and it becomes time-consuming for administrators to update the topology diagrams. When more servers are added to the environment, the existing diagrams become obsolete and will not represent the real topology of the environment.
BizTalk360 overcomes this problem by understanding the complete infrastructure of the server park and plots the dynamic topology diagram of the BizTalk server environment. The diagram is intelligently created; if a new server component is added to the environment, BizTalk360 immediately updates the topology diagram with the new component. This eliminates the need for administrators to manually update the topology diagrams created using Visio and avoid the problem of having outdated diagrams.
Advantages of dynamic topology diagram
- No need to create topology diagrams using Visio.
- The topology diagram is always in sync with the current environment configuration.
- The topology diagram can be easily accessed from the BizTalk360 interface. This avoids the need to go and look into an external repository such as SharePoint and so on.
Viewing the dynamic topology diagram
Follow the steps as shown below to view the topology diagram:
- Log into the BizTalk360 application
- Click 'Administration' tab in the Navigation panel.
- Click the expand button against 'Manage Infrastructure' tab and select 'Topology'.
- Depending on the environment configuration, BizTalk360 will display the topology diagram.
- The topology view helps in monitoring and managing the BizTalk Environment efficiently by providing key metrics and navigation options in a single interface. Belowdetails are shown in the topology.
- BizTalk Server - The name of the BizTalk server can be seen.
- Memory Usage - The memory usage of the environment is captured.
- CPU Usage - The CPU usage of the environment is captured.
- Host Instances - Here, the number of started host instances and stopped host instances are shown. You can navigate to the respective host instance on clicking over here.
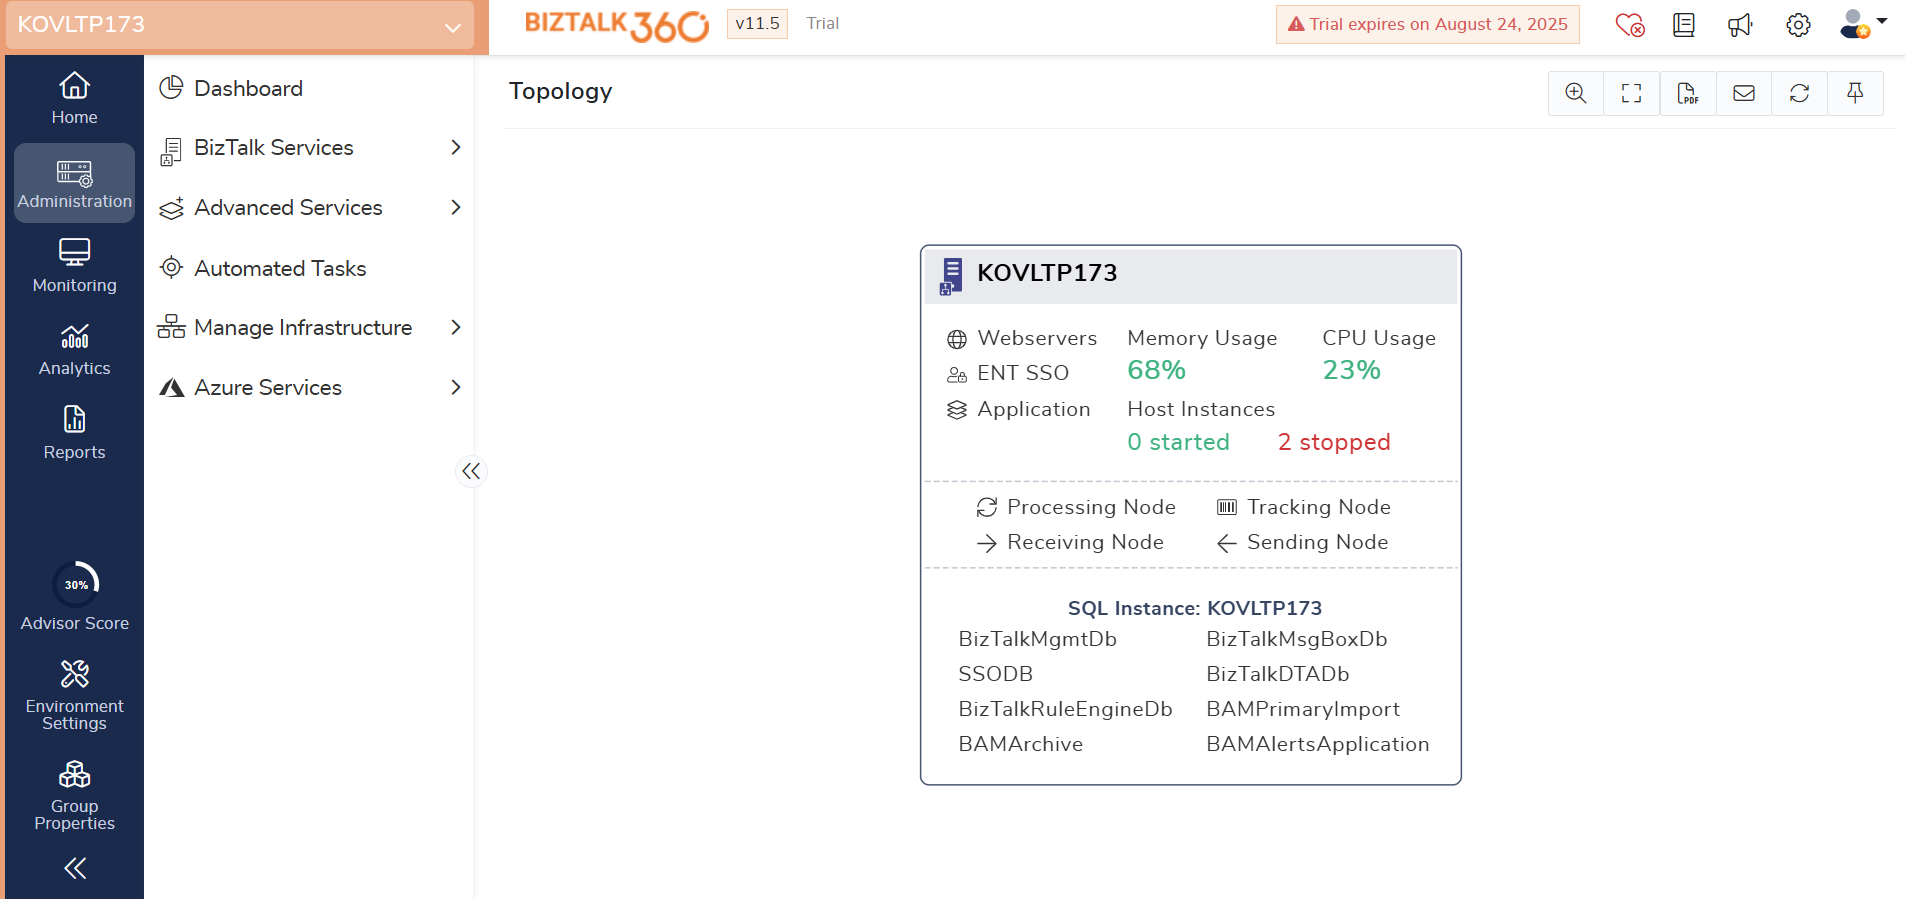
Stand Alone Set Up
In this Set up, BizTalk360 Topology diagram shows the BizTalk and SQL Server along with the processing, tracking, sending and receiving node. This also shows the databases available in the respective server.
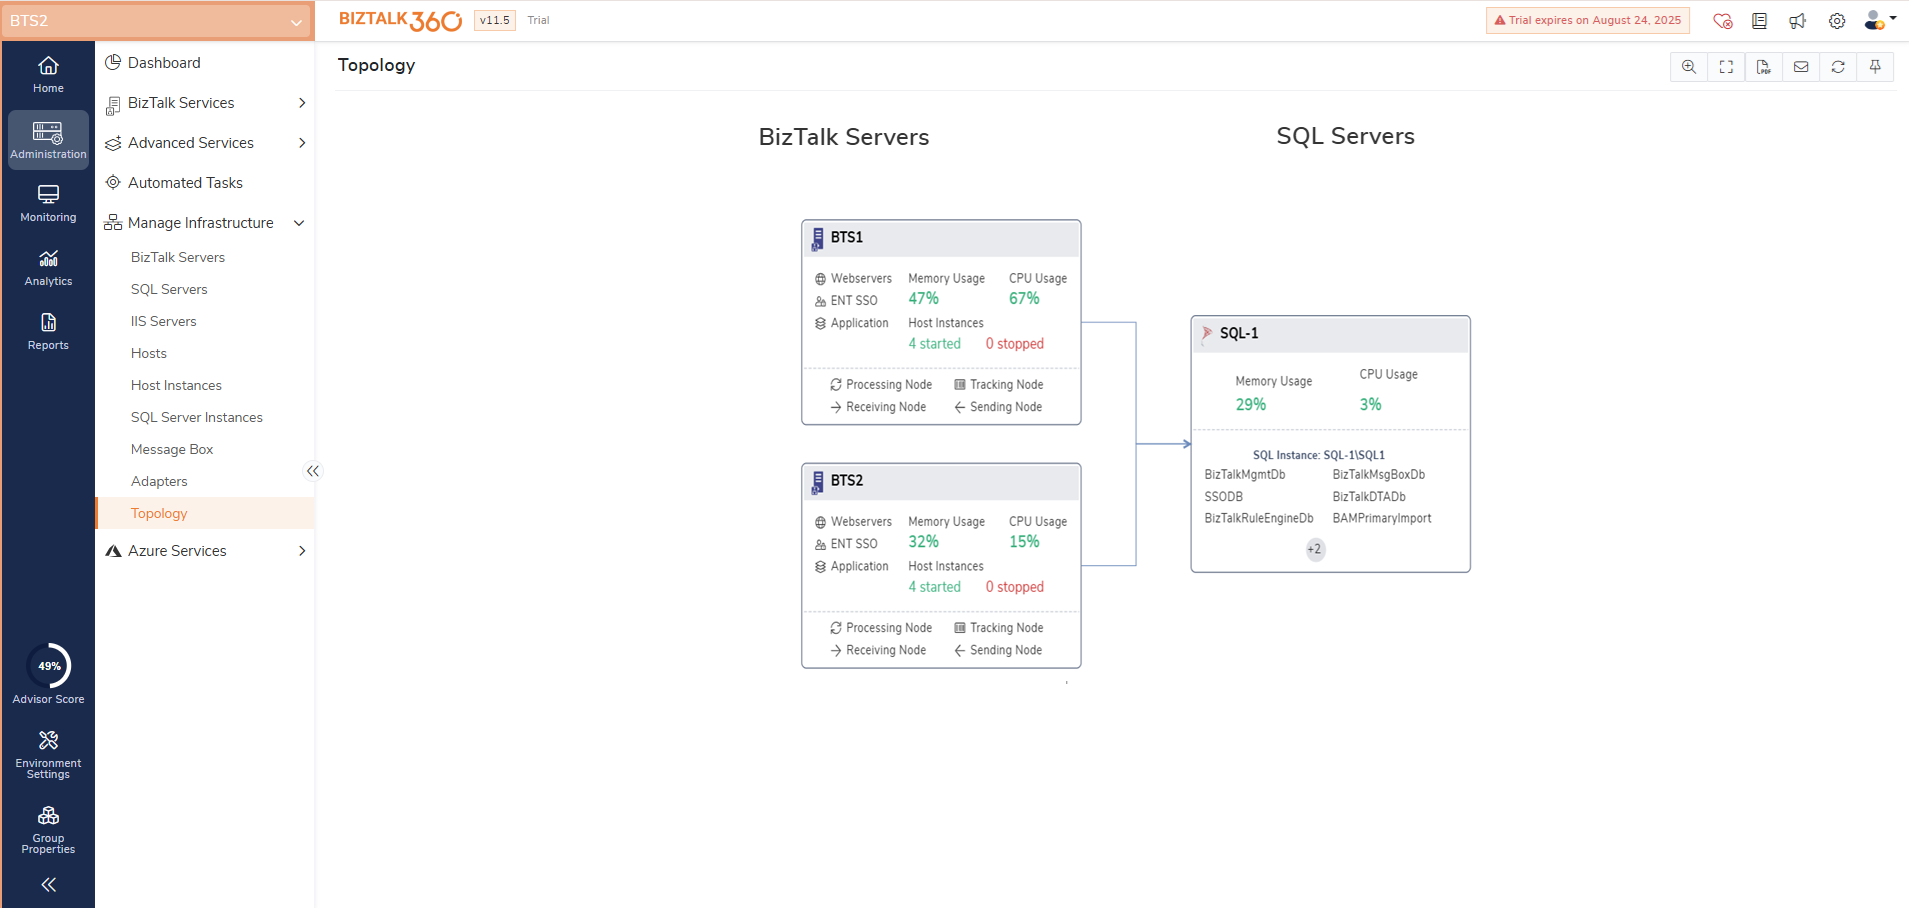
High Availability Set up
The BizTalk360 topology diagram displays the current BizTalk environment configuration. There are two BizTalk Servers, BTS1 and BTS2, each configured with web services, Enterprise SSO, and BizTalk applications. Both have 4 host instances running and none stopped. The SQL Server – One server, SQL-1, hosting all essential BizTalk databases (e.g., BizTalkMgmtDb, BizTalkMsgBoxDb, BizTalkDTADb, BAMPrimaryImport).
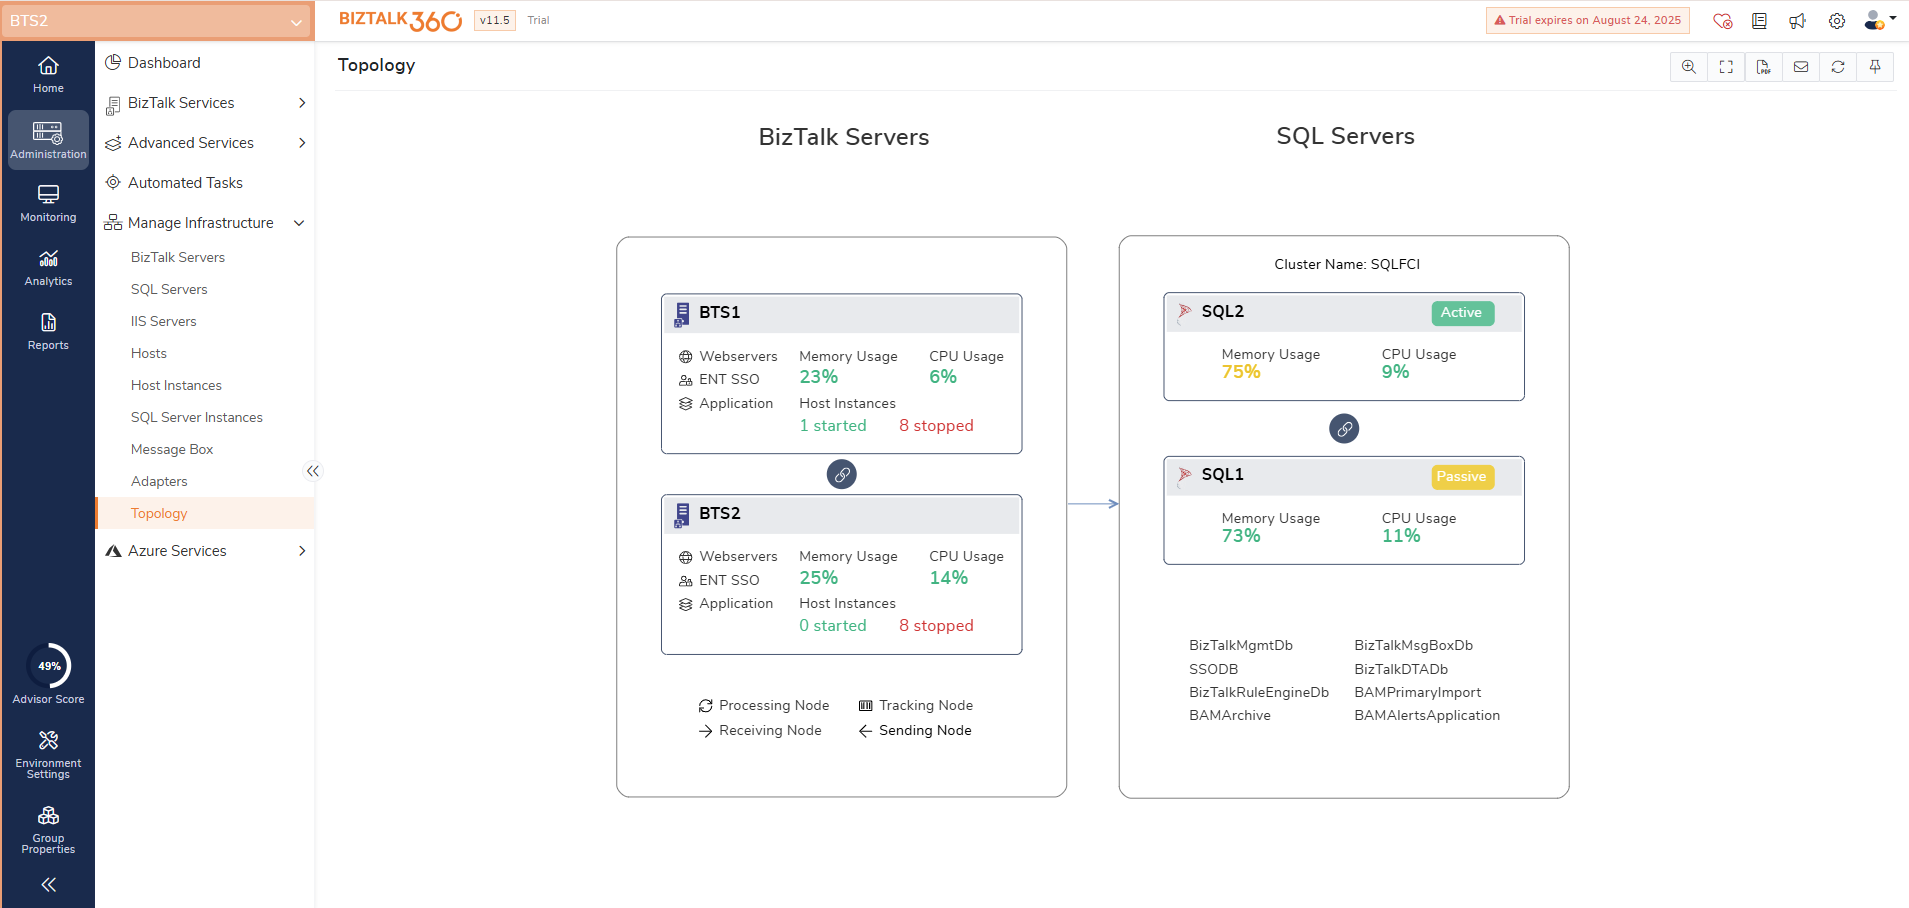
Failover SQL Cluster Set up
In Cluster set up, the active and passive nodes are clearly indicated, allowing users to quickly identify the current state of each node. Consider a BizTalk environment configured in a failover cluster for high availability. If one node fails due to a hardware issue, the system automatically switches to the passive node, which becomes active. Topology shows this transition clearly, allowing users to verify the failover occurred as expected and take action if needed ensuring there are no disruption in business processes.
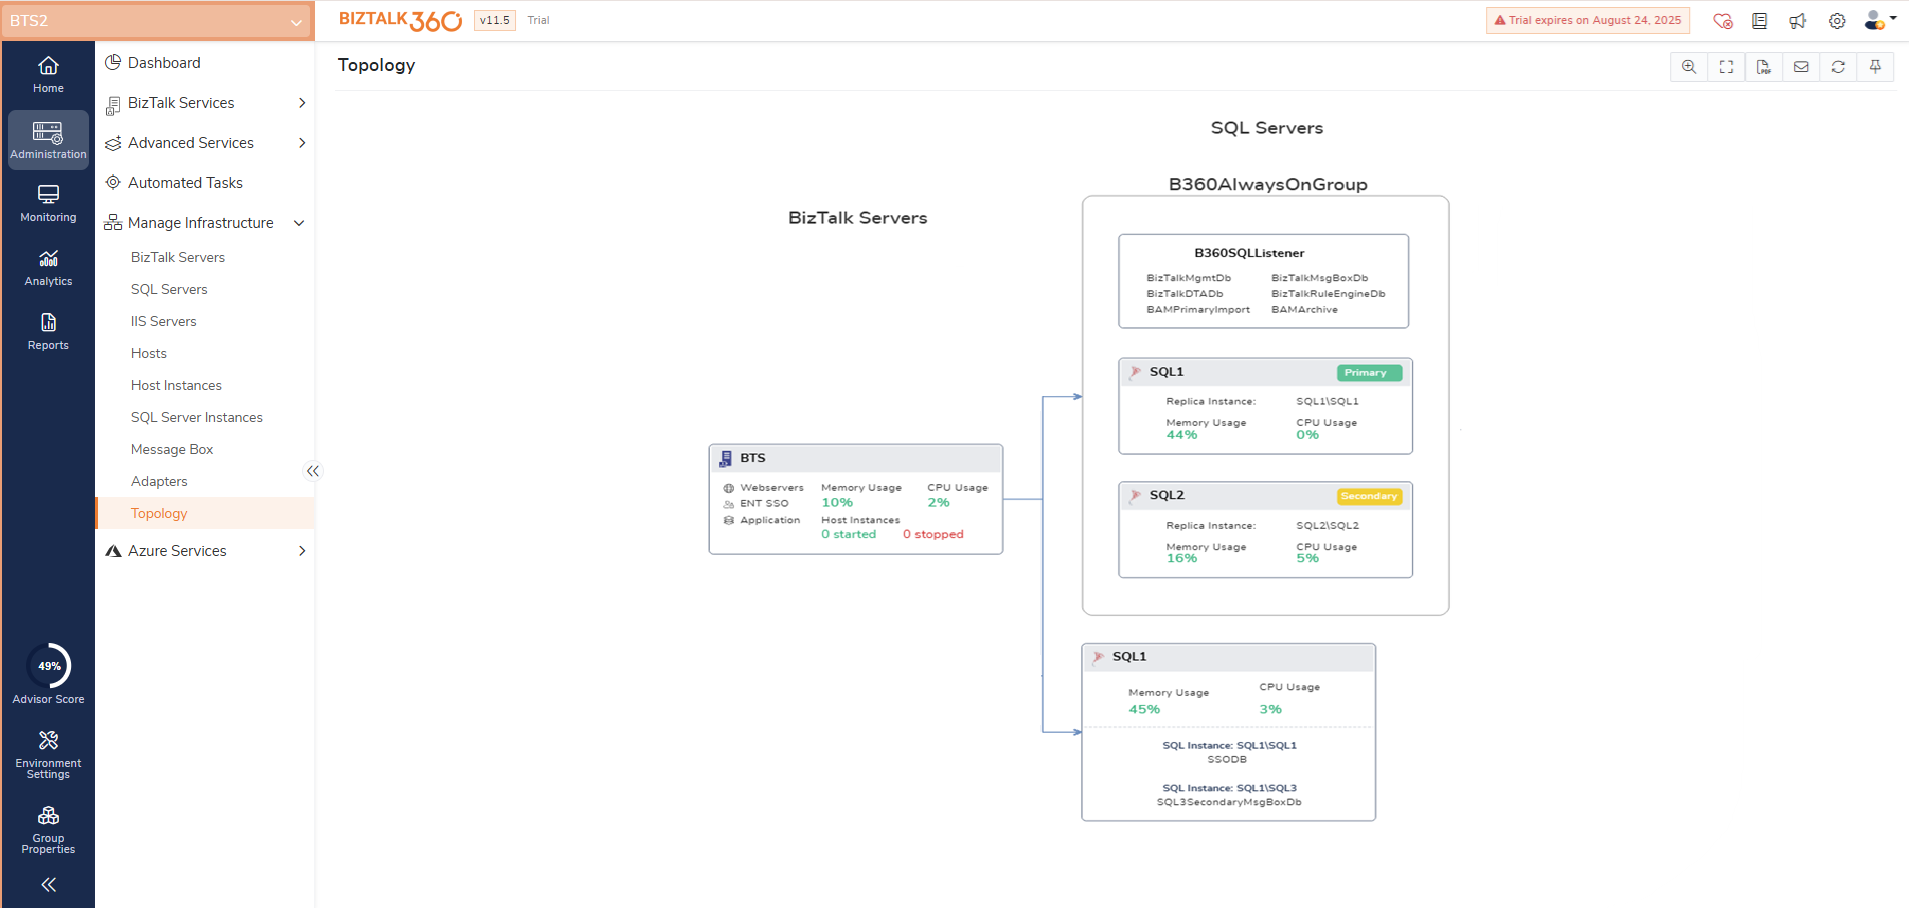
SQL Always On Set up
This topology shows a BizTalk Server environment integrated with a SQL Always On availability group for high availability. BTS server manages BizTalk processing, tracking, sending/receiving, and application hosting. BizTalk databases are part of the B360AlwaysOnGroup, accessed via the B360SQLListener. The Primary Replica is SQL1\SQL1 and the Secondary Replica is SQL2\SQL2. It also has an additional SQL Instances. SQL1 also has hosts SSODB and a secondary Message Box database outside the Always On group.