Tracking is a key feature in any middleware platform. BizTalk Server has the capability to track the information flowing through the system. You can track information like Message Content, Message Context, and Orchestration Events such as begin DateTime, end DateTime, etc. All information can be configured at the Receive ports, Send Ports, Orchestrations, Schemas, Pipelines, and Policies of the deployed BizTalk Applications. The tracked data is stored in the Tracking database (BizTalkDTADb). Tracking can be configured at different levels in the system, being the artifact level and global environment level.
The challenge with the current tracking mechanism in BizTalk Server is that it is not centralized. Users need to configure tracking at multiple places in the administration console and switch between multiple views to get hold of the tracking information. BizTalk360 solves this problem and improves productivity by providing a single page view of all the tracking configuration information at the application level. All the user needs to do is to select the application in the consolidated Tracking Manager screen, and BizTalk360 will display the tracking information for the artifacts of that application.
In addition to displaying the tracking information for the artifacts of the application such as Receive Ports, Send Ports, and Orchestrations, BizTalk360 allows users to enable/disable tracking on the artifacts like Receive Ports, Send Ports, Orchestrations, Schemas, Pipelines, and Policies of the BizTalk Application directly from the BizTalk360 UI.
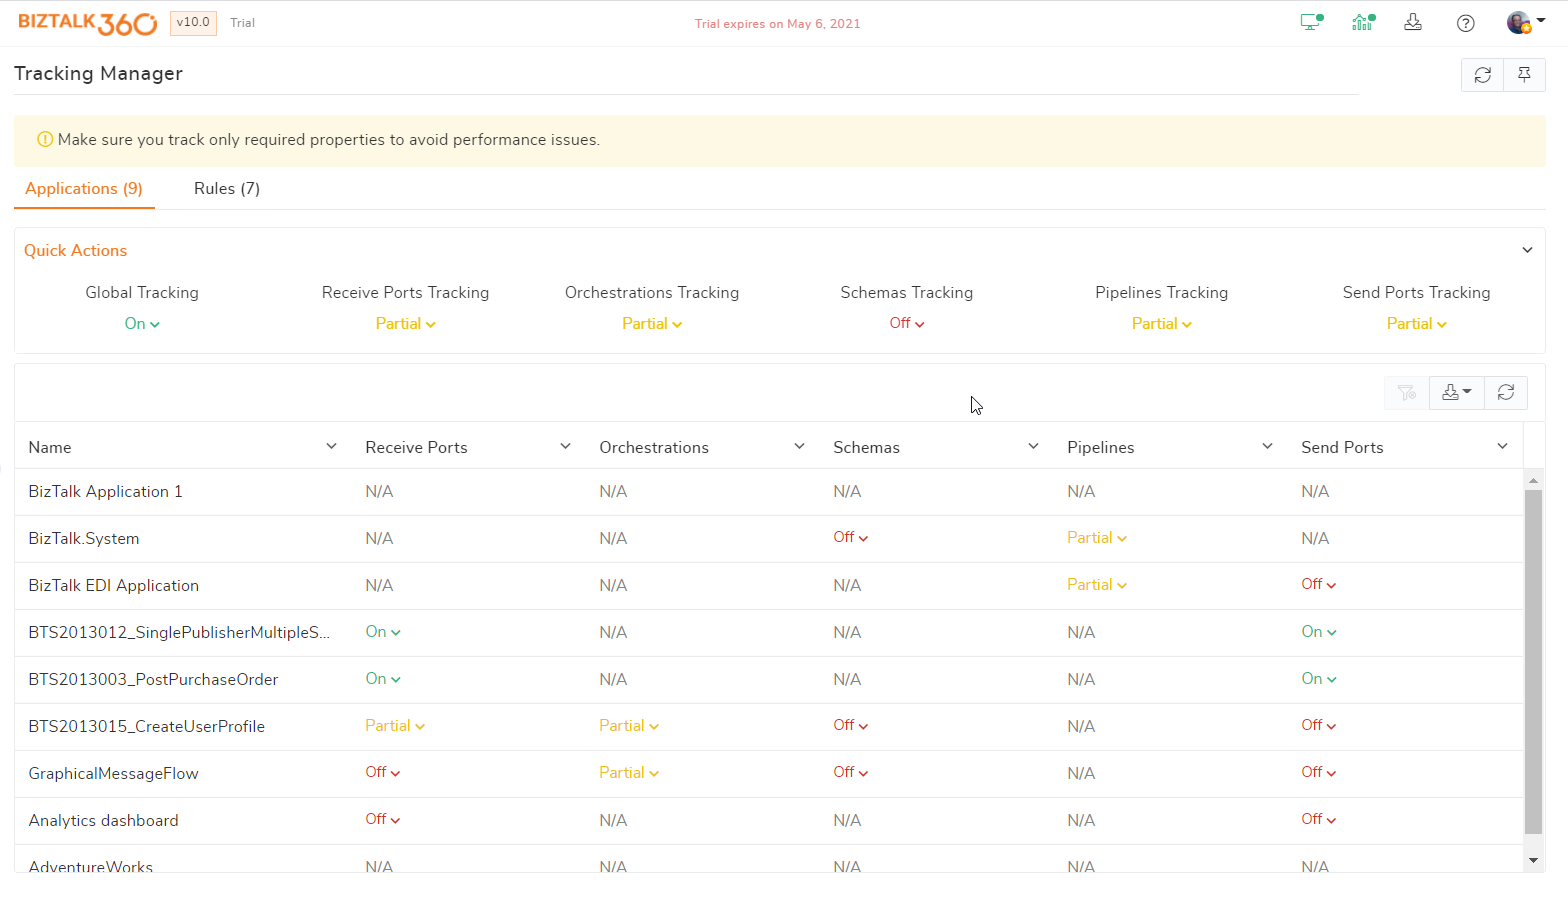
- Quick Actions - The Quick Actions tab displays the overall status of the artifacts in the BizTalk Server. The users can enable/disable tracking on the artifacts globally. One of the main objectives of the Quick Actions section is to make it very simple to configure bulk tracking settings in your BizTalk Environment.
- Applications Tab - The Applications grid view displays the list of Applications in the BizTalk Server and the respective artifacts associated with the Application. The users can enable/disable the associated artifacts with the application from the grid.
- Rules Tab - The Rules tab displays the tracking status of the associated rules from the BizTalk Server. You can enable/disable tracking for Fact Activity, Condition Evaluation, Rule Firing, and Agenda Updates right from BizTalk360.
Tracking Manager Operations
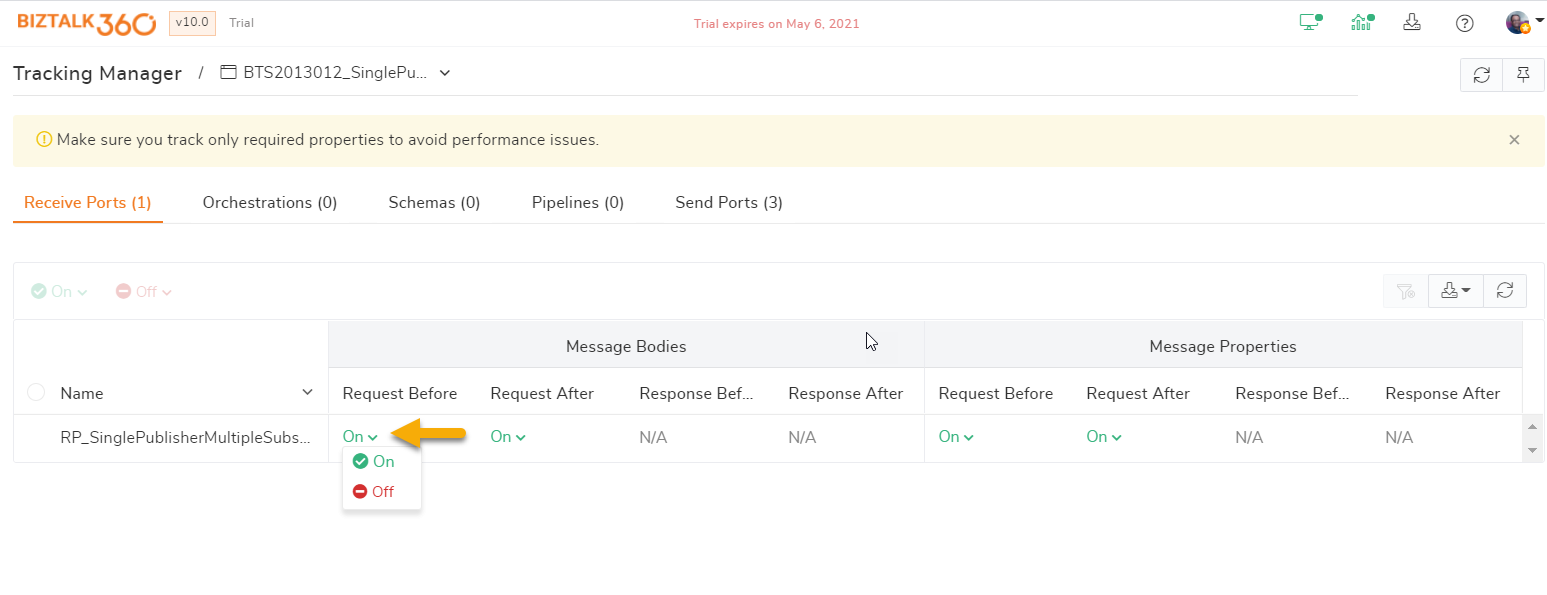
BizTalk360 offers identical functionalities as the BizTalk administration console that allows users to perform enable/disable tracking on application artifacts and rules. The current status indication in the Tracking Manager is color-coded as Green(tracking enabled), Yellow(partial), and Red(tracking disabled). If any of the artifacts or the associated properties of the artifacts are in the disabled state, then the state of that particular artifact, as well as the node (to which the artifact belongs) will reflect the status as "Partial" (in yellow color). You can perform inline operations on the artifacts at four levels:
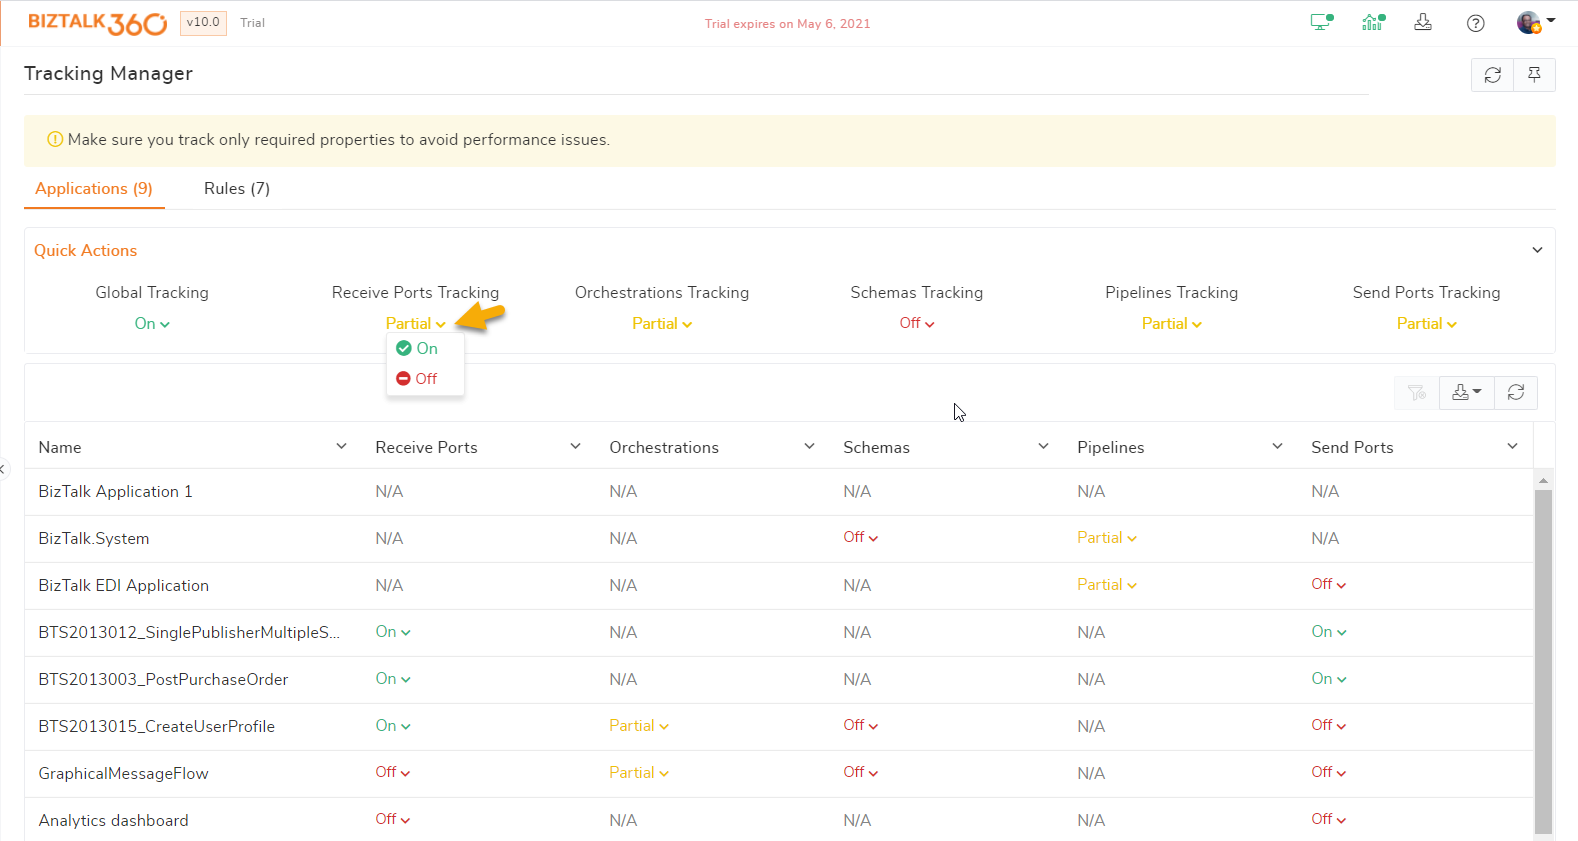
- When you select the drop-down from the artifacts in the Quick Actions tab, you will notice the possible operations that can be performed on the artifact. Enabling/disabling the artifacts from the Quick Actions tab will affect changes across all the applications. Let's say, you wish to disable Orchestration Tracking from the Quick Actions tab, this operation will disable orchestration tracking in all the applications in the environment.
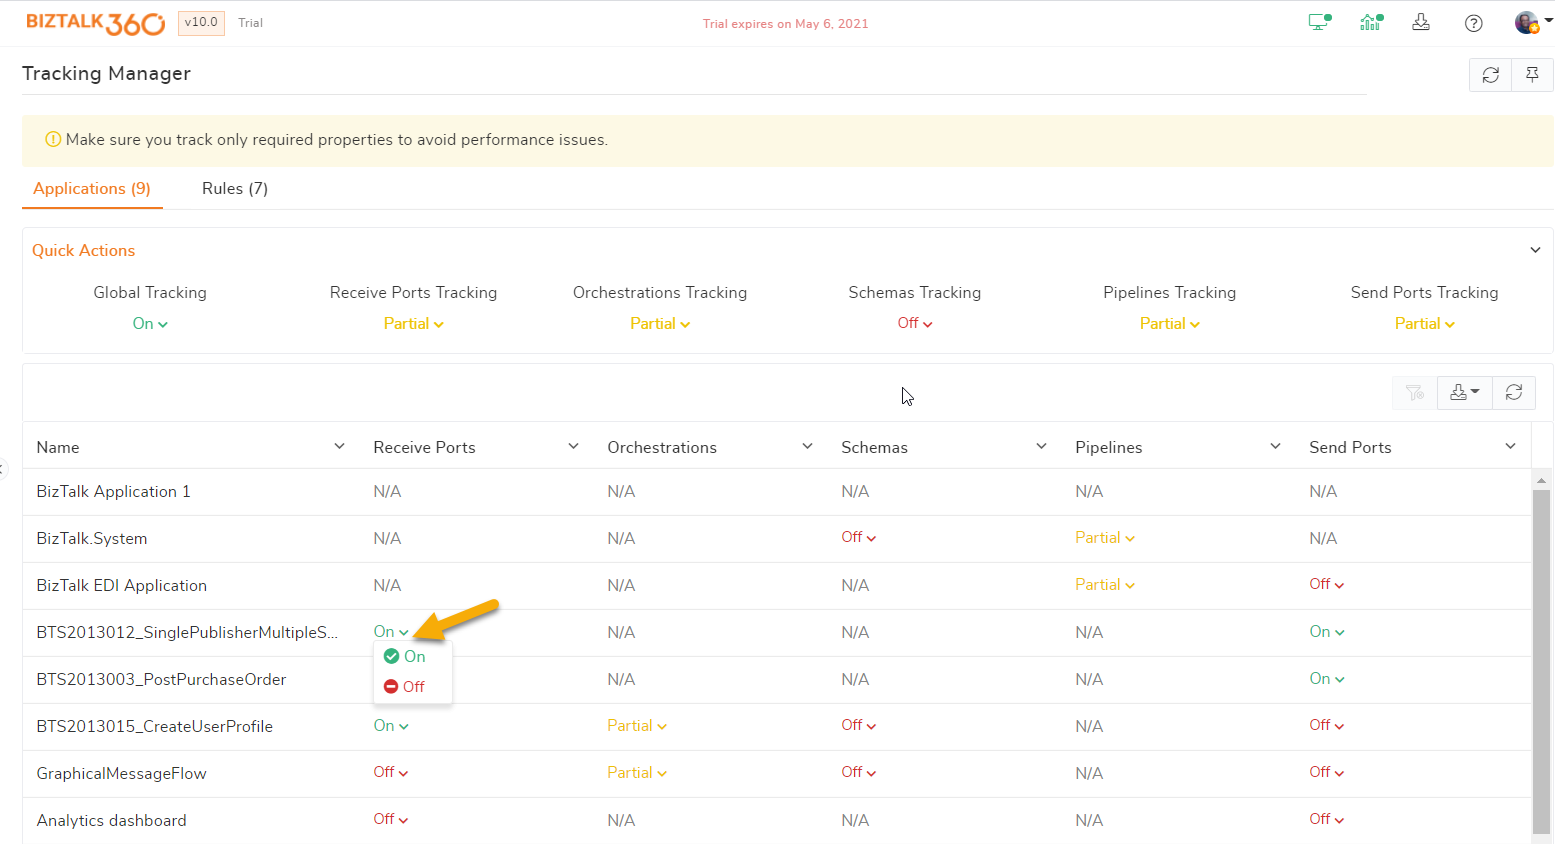
- When you select the drop-down from the Application grid, you will notice the possible operations that can be performed on the artifact. This will enable/disable the artifact, say all the Receive Ports associated with that application.
- Click the application you wish to view/change tracking properties. When you do this, you will notice an inline operation showing up right next to the current state of the possible operations that you can perform on the artifact.
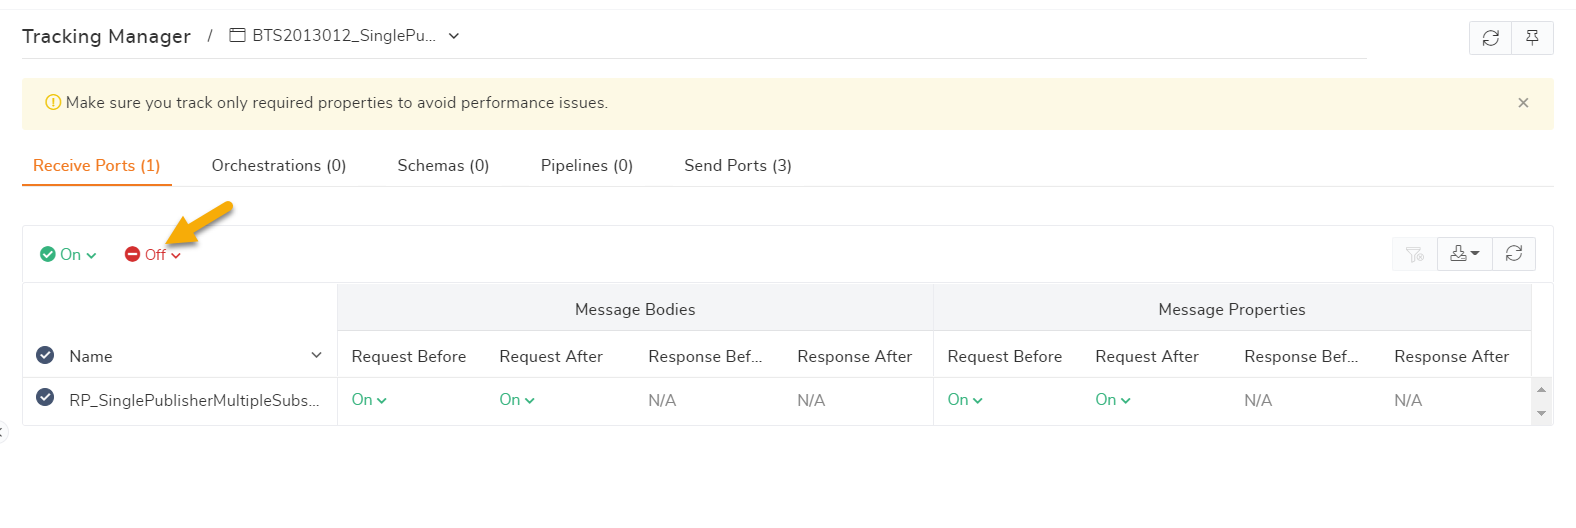
- You can also change the tracking state by selecting the artifact (checkbox) and clicking on the Operation buttons (Enable/Disable) at the top of the grid.
Filter Implementation for Grids
A Filter capability is implemented for the grid columns to do a better search from the grid columns. A user can filter the data from the respective rows according to their needs.
The following types of filters have been implemented in the grid columns of the Tracking Manager:
- Status Filter
- Text Filter
Status Filter
The status filter is used to filter Status columns. The drop-down of the filter shows values according to the statuses which are displayed in the column. The user can select the status from the drop-down and filter accordingly.
Text Filter
This is the most commonly used filter. Using this filter, a user can perform a text-based search. The text filter has the following options:
- Is equal to
- Is not equal to
- Starts with
- Ends with
- Contains
- Does not Contains
- Is Null
- Is not null
- Is Empty
- Is not Empty
View Tracking Information of the artifacts
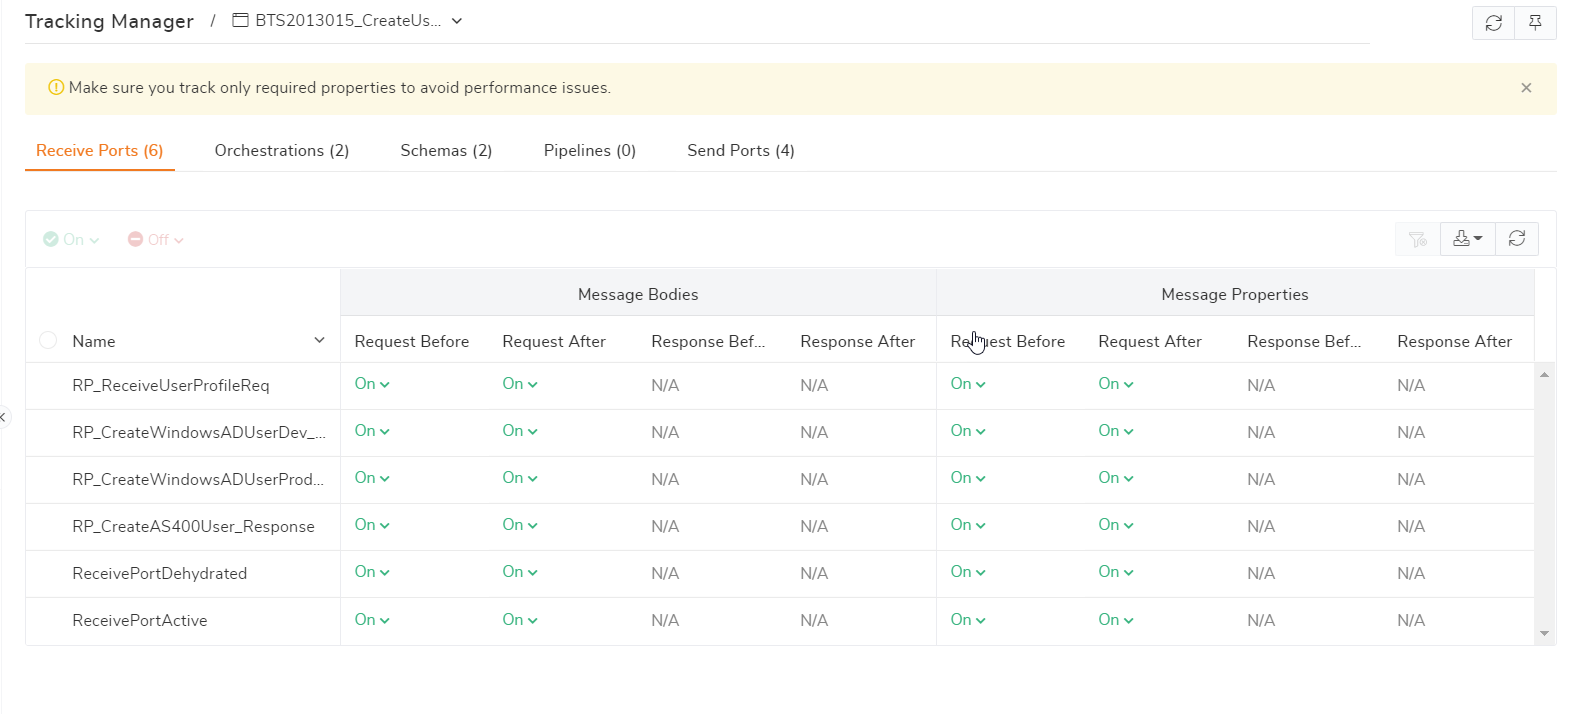
Once the tracking has been set in the BizTalk Administration Console for the application artifacts, users can view the tracking configuration information in BizTalk360 under the Tracking Manager section. The Tracking Manager section displays the information for Receive Ports, Send Ports, and Orchestration artifacts of an application.
Follow the steps as shown below to view the tracking information:
- Log in to the BizTalk360 application
- In the Landing Page, select an environment
- Click the Administration tab and expand button against the BizTalk services tab and select the Tracking Manager link
- Select the application from the drop-down at the top right corner of the page
- Click the Receive Ports, Send Ports, and Orchestrations tab to view the tracking information