In BizTalk integration, high volumes of data transactions pass through the Message Box. To keep track of all the integration transactions, tracking may be enabled in an environment that causes a performance impact. So it's very important to get performance insight into the BizTalk environment. BizTalk360 provides an interface for querying the performance metrics across the environment and viewing the performance data in one place over different time frames.
This feature makes it simple to understand more about Windows performance, BizTalk messaging, and tracking data. Below are sample kinds of data you can view on the performance query page
- Windows Performance - The user can view the CPU or Memory usage of the last 1 hour or during a specific period of time
- BizTalk Messaging Performance -The user can view the active or processed message thread on each host instance, the Spool Size of the Message box, Host queue length, Message Latency, etc
- Tracking data performance (Failure or Success count of ports, schema, and so on), as well as the instance count of each application or artifact, can be viewed
Enable Performance Data Collection
As a first step for collecting performance and tracking data, the user must enable data collection in the settings side. Follow the below article to enable performance counters for data collection.
Once the data collection is enabled, the BizTalk360 system will collect the performance data for every minute and store it in a BizTalk360 database.Users can view the collected performance data in the UI with rich querying capabilities.
Query Performance Data
- Navigate to Administration->Advanced Services->Performance Queries and build a query to view the required data
- Choose either the Performance or Tracking data, you wish to view. construct the query to drill down and view specific data for the specific counter
- Set the number of records to be fetched from the database, Ex 10,25,20,100. These are default values however you can change these values in the system settings
- Click Add Filter Icon '+' to add more query filters.The filter should be added only in this order Metric Type->Server->Category->Counter Name ->Instance Name
- The Filter Operator in most cases will be 'Is Equal To', But In the case of Collected Date Time the filter option will be 'On or Before' or 'On or After
- To delete the added filter criteria click on the remove button 'x'
- Once the query is constructed with the filter options click on 'Run Query' to view the data.
- The constructed query can be saved for further access. Click on the 'Save Query' option and update the query name. Users can even pin this Saved query as a widget in the dashboard and view the query result in the dashboard.
- Click on the 'Export Excel' option to download the queried performance data in the local server in an excel format.
Access Policy
Only super users have the ability to enable or disable the performance data collection.
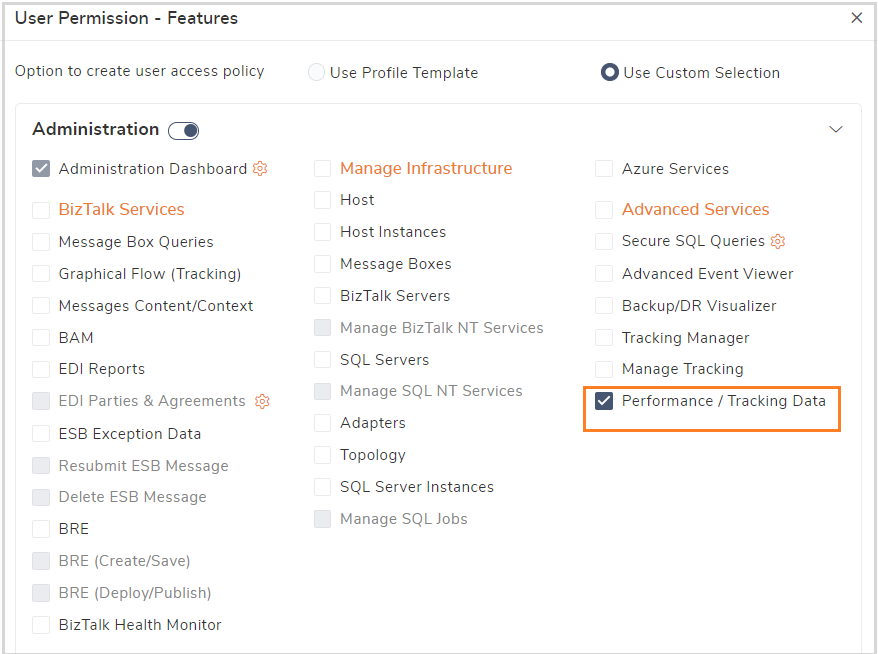
All the super users can view the collected performance data in the administration module. However, the custom user must have access to 'Performance/Tracking Data' to view the data.
Licence Tier
The environment must be updated with the BizTalk360 Platinum License to access the performance data .