Why Custom Widgets?
In the Analytics dashboard, we have an option to configure performance widgets to the dashboard. Once you enabled any of the types (BizTalk, SQL, IIS, and Windows) in any selected environment, the BizTalk360 Analytics service will start collecting the performance metrics. These performance metrics can be mapped to the custom widget. Follow the below articles to enable performance counters for data collection.
Let’s take a scenario to understand what we can achieve with the custom widgets. Using Analytics custom widget, you can determine the Suspended messages metrics and also the number of instances, per host instances, in a graphical representation. For this, you need to enable the Performance counter Server->BizTalk->BizTalk: Message Box: Host Counters. Once you enabled the metrics and configured to the widget, it will fetch the current metrics values and represent them in a graphical way. If you would like to compare the performance of two BizTalk servers and find which server consumes more memory and CPU. This can also be achieved by configuring servers and selecting the appropriate metrics for the widgets.
Custom widgets offer users the ability to define and display customized performance metrics based on the business requirements. In the Analytics dashboard is provided with two options to customize.
- BizTalk Widgets
- Azure widgets
In this article, we will take a comprehensive look into the steps involved to add a Custom Widget into an Analytics Dashboard. Custom widgets are allowed to add in both the Home (Analytics) Dashboard (default dashboard) and Custom Dashboards.
BizTalk Custom Widgets
BizTalk related performance and tracking widgets can be added to the dashboard. Once you enabled any of the performance data collection types (BizTalk, SQL, IIS, and Windows) in any selected environment, the BizTalk360 Analytics service will start collecting the performance metrics. These metrics can be mapped to the custom widget. BizTalk's performance and tracking metrics can be added as widget in customized manner with custom date\time range and user defined Graph type with legend names.
For Instance, assume there is a BizTalk environment with multiple applications. In that monitoring the performance of each application in terms of message processing is important. Creating a custom widget that maps the "messages processed" metric provides users with a visual and quick overview of processing counts across different applications. This setup facilitates the timely identification of unusual patterns, such as sudden spikes or drops in message counts, enabling users to promptly address potential issues.
Follow the steps as shown below, to add a new custom widget to the dashboard.
- On the Analytics Dashboard, click Add Widget.
- Click the 'Add Custom Widget' option at the bottom of the Add Widget blade.
- In the 'Add New Widget' blade, enter the widget title.
- Date Range - Select the date range for the chart. The options are Last 24 Hrs, Last 7 days, Last 30 days, and Custom.
- Last 24 Hrs. - Displays the data from the last 24 hours.
- Last 7 days - Displays the data from the last 7 days.
- Last 30 days - Displays the data from the last 30 days.
- Custom - you can provide your custom values for months/weeks/days/hours/minutes based on your need. For example, you can easily configure the last 10 months / 6weeks/ 2hours data by using this custom option.
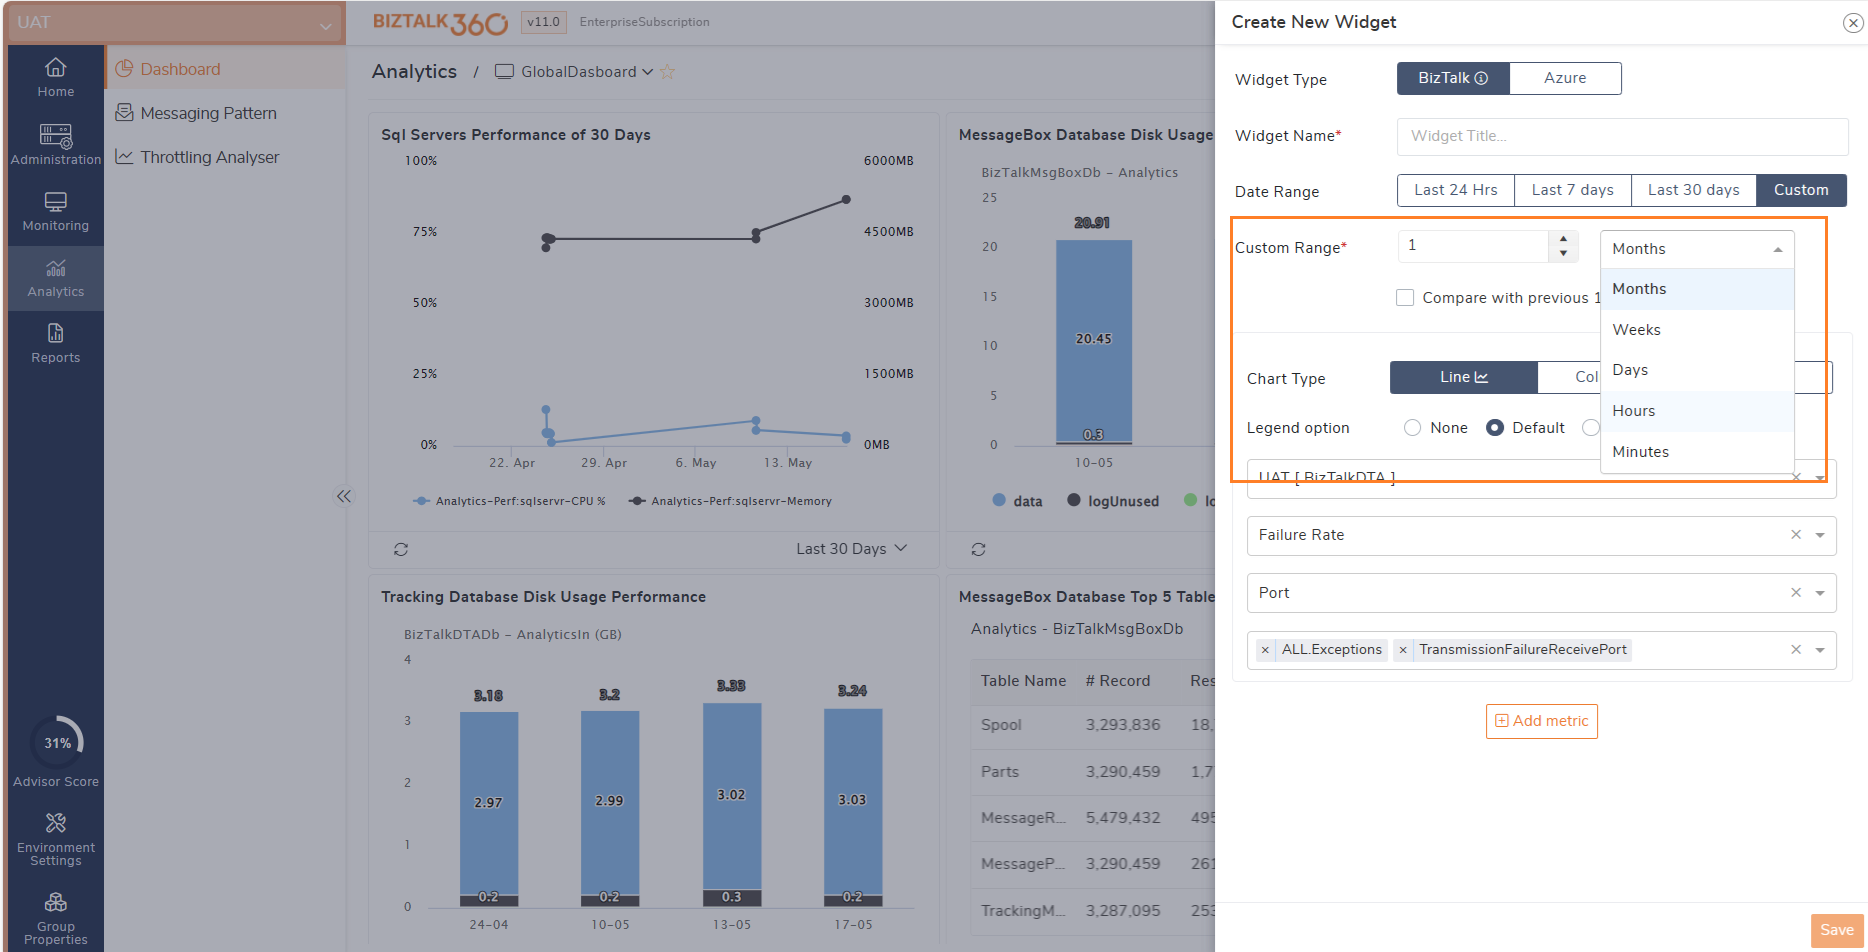
- Compare with Previous Hour/Day/Month - Select this check box to compare the real-time data with the previous Days/Weeks/Months. This option is allowed only for a single metric. For instance, assume that this check box is enabled and last 24 hours is selected for the widget. In this case the system will compare the live data and last 24 hours data and gives result of both the time range. This helps to get a clear view of variation happened in last 24 hours.
- Select the 'Type of Chart' and the 'Legend option'.
- Choose the Artifact and Category - Select the artifact and category that you want to generate the chart.
- click the 'Save' button to close the Add New widget blade.
Azure custom widgets
View the metrics details of Azure services like Logic Apps, Azure Service Bus Queues, and Topics in the Analytics Dashboard and get the scheduled reports. You can visually assess the impact of changes or optimizations, making it easier to fine-tune azure resources for optimal performance.
Use Case 1: You can configure the custom widget to your analytics dashboard with selected azure subscription and the metric as "Runs Succeeded" with multiple logic apps. As The number of runs succeeded directly reflects the reliability of your Logic App workflows. A higher count indicates that the majority of runs are completing successfully, meeting the intended business logic without errors.
Use Case 2: You can get the number of active messages in multiple queues, just by configure the custom widget to your analytics dashboard with selected azure subscription and the metric as "Number of active messages in queues" with multiple service bus queues. Which help in knowing the Count of active messages in a queue or subscription that are in the active state and ready for delivery. The messages are available to be received.
Use Case 3: You can also configure the custom widget to your analytics dashboard with selected azure subscription and the metric as "successful requests" with service bus topics. Since successful requests provides an overall indication of the operational health of your Azure Service Bus. A consistently high number of successful requests indicates that your messaging system is operating efficiently and meeting service expectations.
Similar to the BizTalk widgets you can add the azure widgets in Analytics dashboard once after adding the azure subscription into your BizTalk360 environment. It is same as BizTalk widget to configure till the chart type and below are steps to add azure widget.
- Subscription -Select the subscription from the list of azure subscription added in your environment.
- Artifact type- Select artifact as Logic app, Queues or Topics.
- Group by option- When you select metric.
- Group BY metric - Based on the Artifacts type selection, you can view all the associated metrics in the widgets.
- Group By Resource - you can view the performance data of single metric with multiple Artifacts in the widget.
- Widget Metric - You can select the metric from list for any azure artifact type. (Maximum of 10 artifacts can be selected)
- Aggregation type- For selected metric you can choose type of aggregation in which the data will be shown.
- Total– the sum of all values captured over the aggregation interval.
- Count – the number of measurements captured over the aggregation interval. Count doesn't look at the value of the measurement, only the number of records.
- Average – the average of the metric values captured over the aggregation interval. For most metrics, this value is Sum/Count.
- Minimum – the smallest value captured over the aggregation interval.
- Maximum – the largest value captured over the aggregation interval.
Note: The aggregation interval is 1 hour.
Widget editing
If you have a widget that shows the message counts of a selected receive port, and you've added a couple of new send ports in the same application, you don't need to add another widget. Instead, you can customize the existing widget by configuring it to include the new send ports, allowing you to view the message count of all ports in one widget.
The added widget can be modified as per you needs like
- Changing the widget name.
- Switching between the time ranges.
- Enable\disable the compare with previous data.
- Switch the chart types from Line, columns and Area.
- Also, the Category and counter can be changed.
Multiple metrics in Single widget
BizTalk360 custom widgets allows you to have multiple metrics over a widget, consider a scenario where you need to gather all information related to the messaging process of an application. This includes application-level message count, application artifact-level message count, average execution time, and failure messages at the port level. Instead of having separate widgets for each metric, you can consolidate them into a single widget for a comprehensive view.
Deleting a Custom widget
we will take a look at the steps to remove a widget from an Analytics Dashboard. As mentioned in other articles, a widget can be added to the Analytics home dashboard and Custom dashboards. A widget can also be removed from the dashboard with below step.
Click Customize. This will change the dashboard into a customizable area. Select the widget to be deleted and click the gear icon on the widget and then hit 'Remove widget'.