What is the purpose of ESB Data Monitoring?
The Exception Management capability that comes with the Microsoft Enterprise Service Bus (ESB) toolkit is widely used across organizations to handle the exceptions uniformly among all BizTalk applications. BizTalk360 solves the challenge involved in setting up the ESB toolkit by allowing administrators to easily configure the Exception Management capabilities and start viewing and handling the exceptions within the UI.
In addition, BizTalk360 offers capabilities where administrators can automate the process of looking for a specific fault code in a particular application and get notified when the condition is actually met. For instance, the administrator can set up an ESB data monitor as "Look for fault code 0xc0c01687 in GlobalBank.ESB application and warn me when there are more than 25 faults and throw an error when there are more than 50 faults at every 1-hour cycle during my business hours (9 AM to 6 PM) on weekdays." With this, the administrator can avoid querying the exception database often to look out for fault codes in a specific application.
Setting up an ESB Data Monitor
Follow the steps shown below to create an ESB Data Monitoring alarm:
- In case you did not do it earlier, follow the steps mentioned in this section to create a Data Monitoring alarm
- Select the Use this alarm for Data Monitor Alerts check box to map the current alarm to Data Monitors. Only when this option is selected, does the Notify on Success as well checkbox gets activated
- The Notify on Success as well check box is optional for Data Monitoring, while the Use this alarm for Data Monitor Alerts option is mandatory
- Click OK to save the alarm information
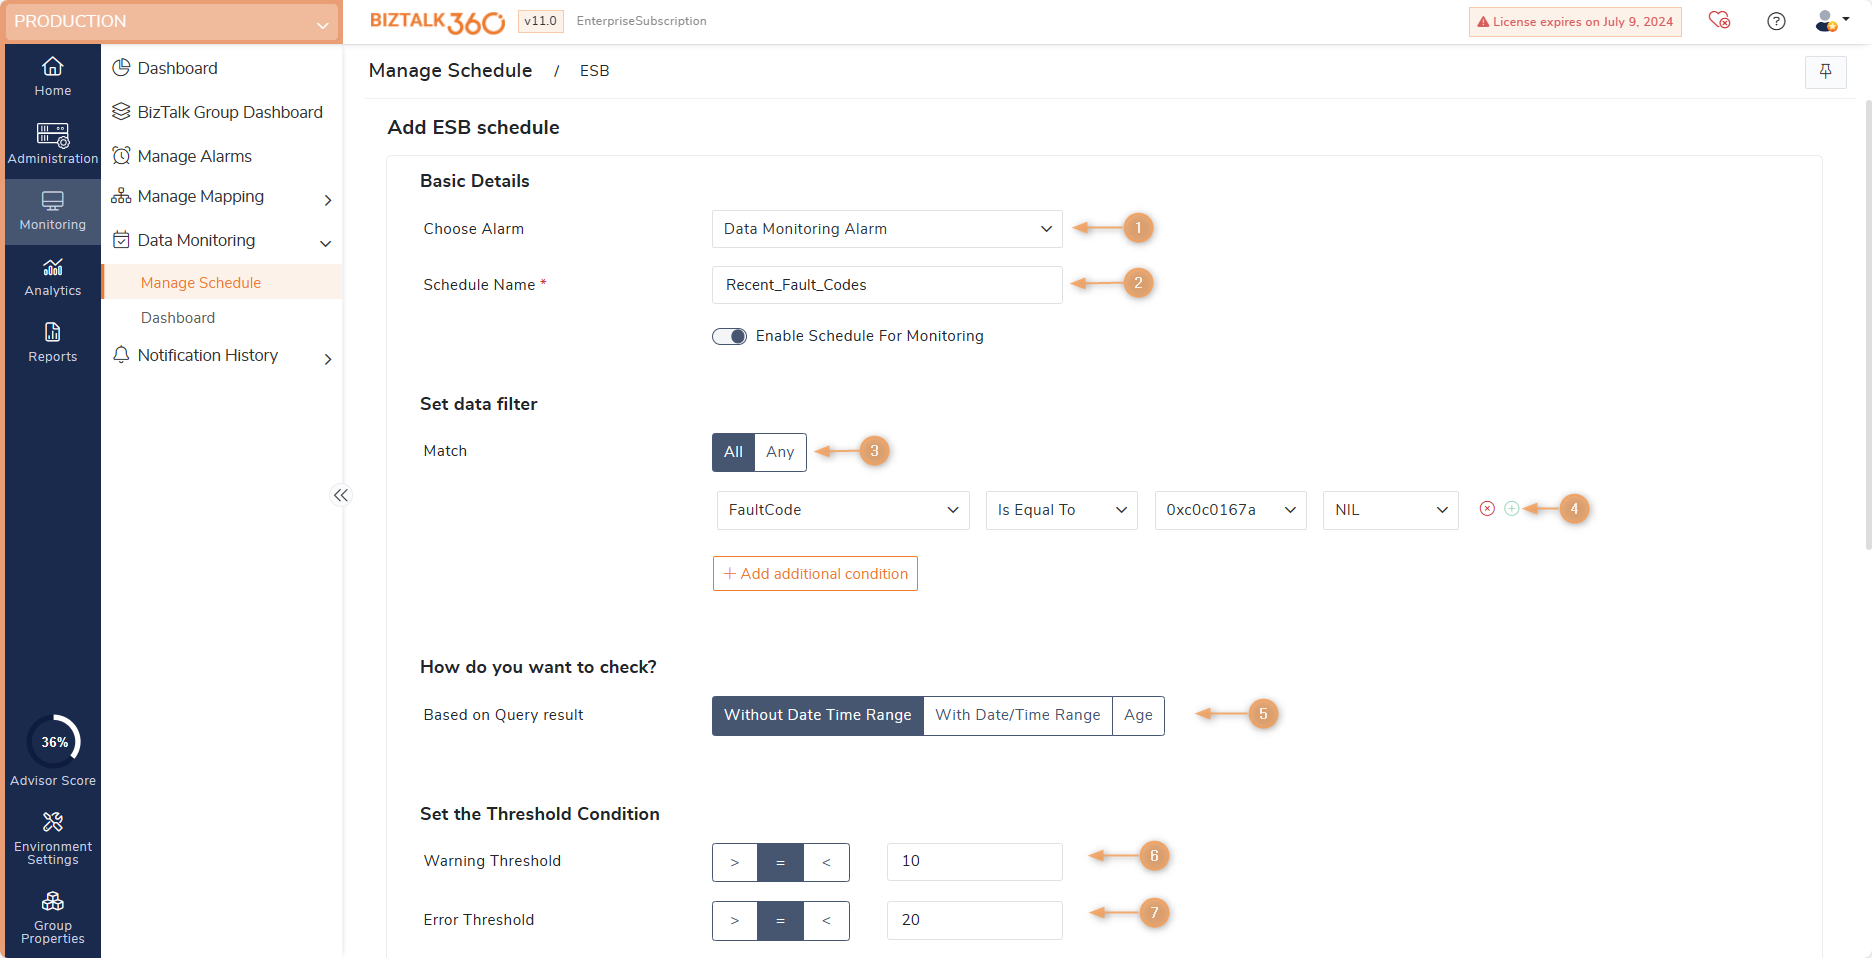
- Choose Alarm - As mentioned above, the first step to set up ESB data monitoring is to create an alarm. Once you have created the alarm, the alarm name will be displayed in the drop-down. Select the alarm that should be used for ESB data monitoring purposes
- Friendly Monitor Name - A meaningful name for the ESB Data Monitor. Say, as per your requirement you want to get notified with a warning message when the number of faults is > 25 in a specific application and throw an error notification when the number of faults is > 50. The monitor name can be set as "Fault code in the application GlobalBank.ESB > 25, trigger warning; > 50, trigger error"
- Match - This section is very similar to the ESB Exceptions section in BizTalk360. Select "All" or "Any" from the drop-down before adding a filter in the next step
- Add a filter - To filter the query results based on different parameters (application, fault code, fault category, error type, severity, description, exception message, exception stack trace)
- How do you want to check
- Based on only Query result without date/time range - Selecting this option will execute the query without applying any date time filter. i.e All the data will consider for ESB query execution.
- Based on Query result with date/time range - Selecting this option will apply the DateTime filter for ESB query execution. ( The values configured for setting trigger time, Set Monitoring Times ->At What Time, will be used for the DateTime filter ). Say, for instance, if the data monitor is scheduled to execute every hour from 9 AM to 6 PM, and currently, the time is 11:59 AM, during the next run of the data monitor at 12 PM, it will look for the query results between 11:01 AM and 11:59 AM and generate the results
- Based on Query result (Age)-In V10.1 age monitoring is introduced, which allows you to check the instances which are older than a specific time duration. You can provide the Age value in minutes/hours/days, only the instance created during that time will be considered for ESB Query execution.
- Warning Threshold - Select the value from the drop-down on when you want to be notified when there is a warning. The first drop-down is to select the Operator (> or =) and the second operator is to select the warning value. For e.g., When the number of fault codes is> 25, throw a warning.
- Error Threshold - Select the value from the drop-down on when you want to be notified when there is an error. The first drop-down is to select the Operator (> or =) and the second operator is to select the warning value. For e.g., When the number of fault codes is> 50, throw an error.
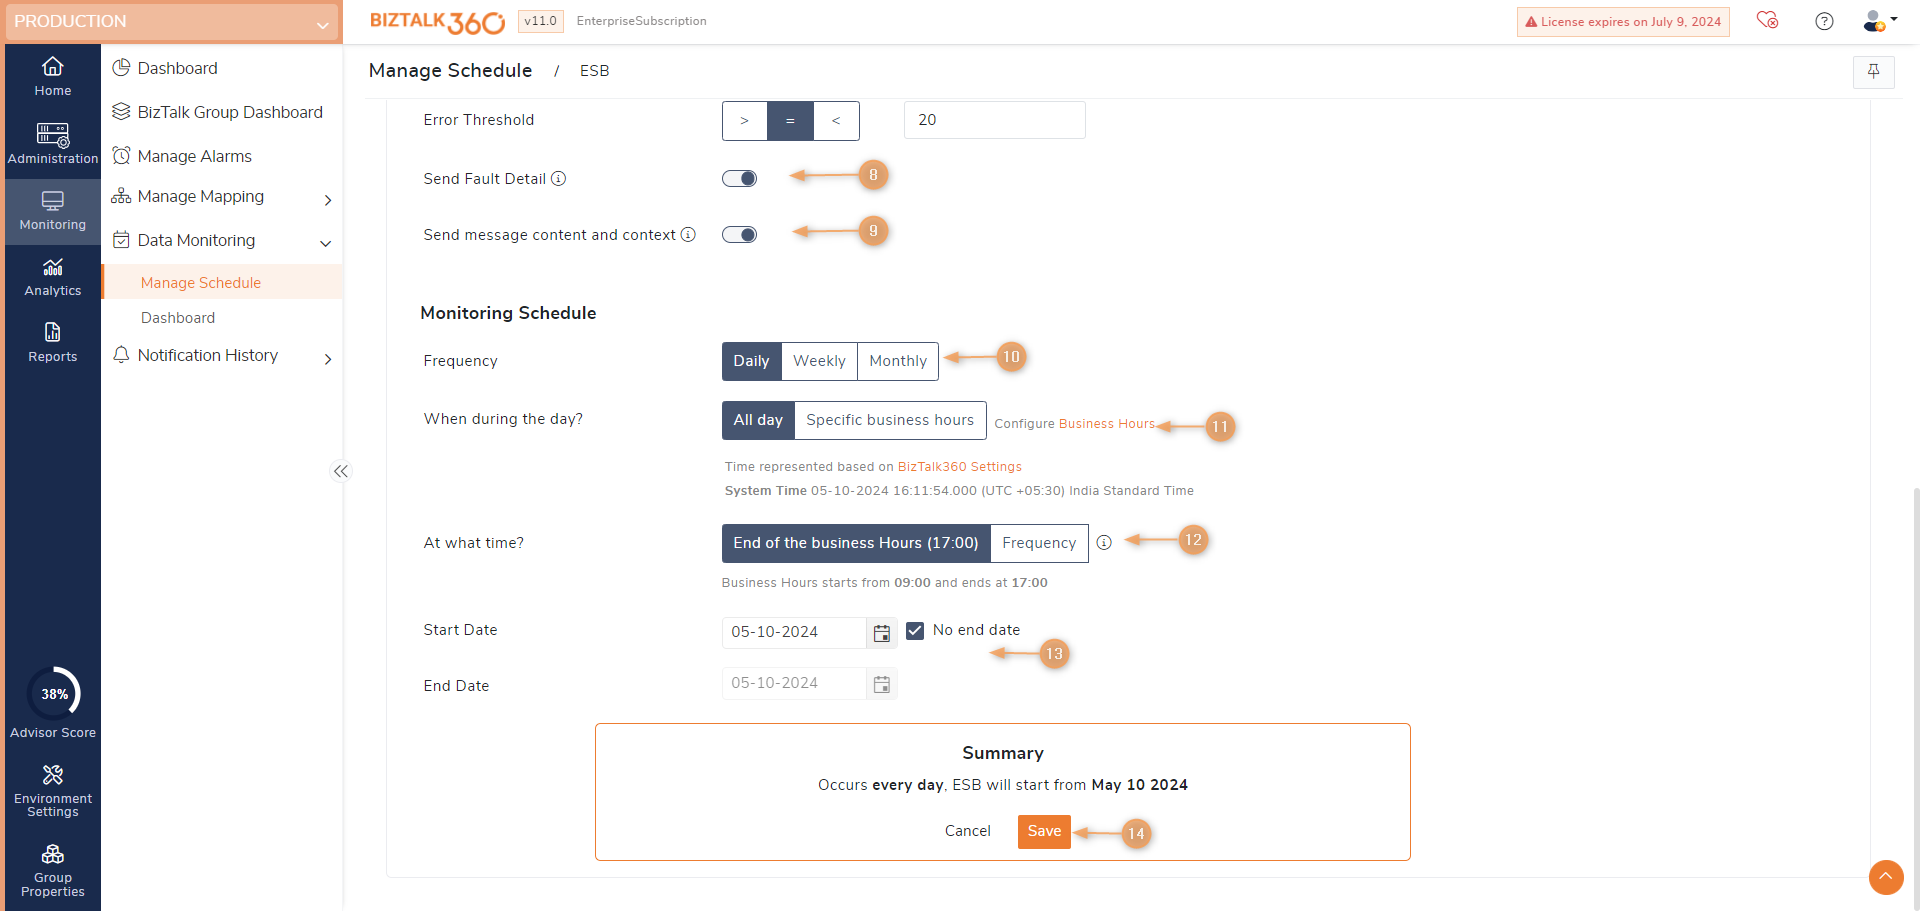
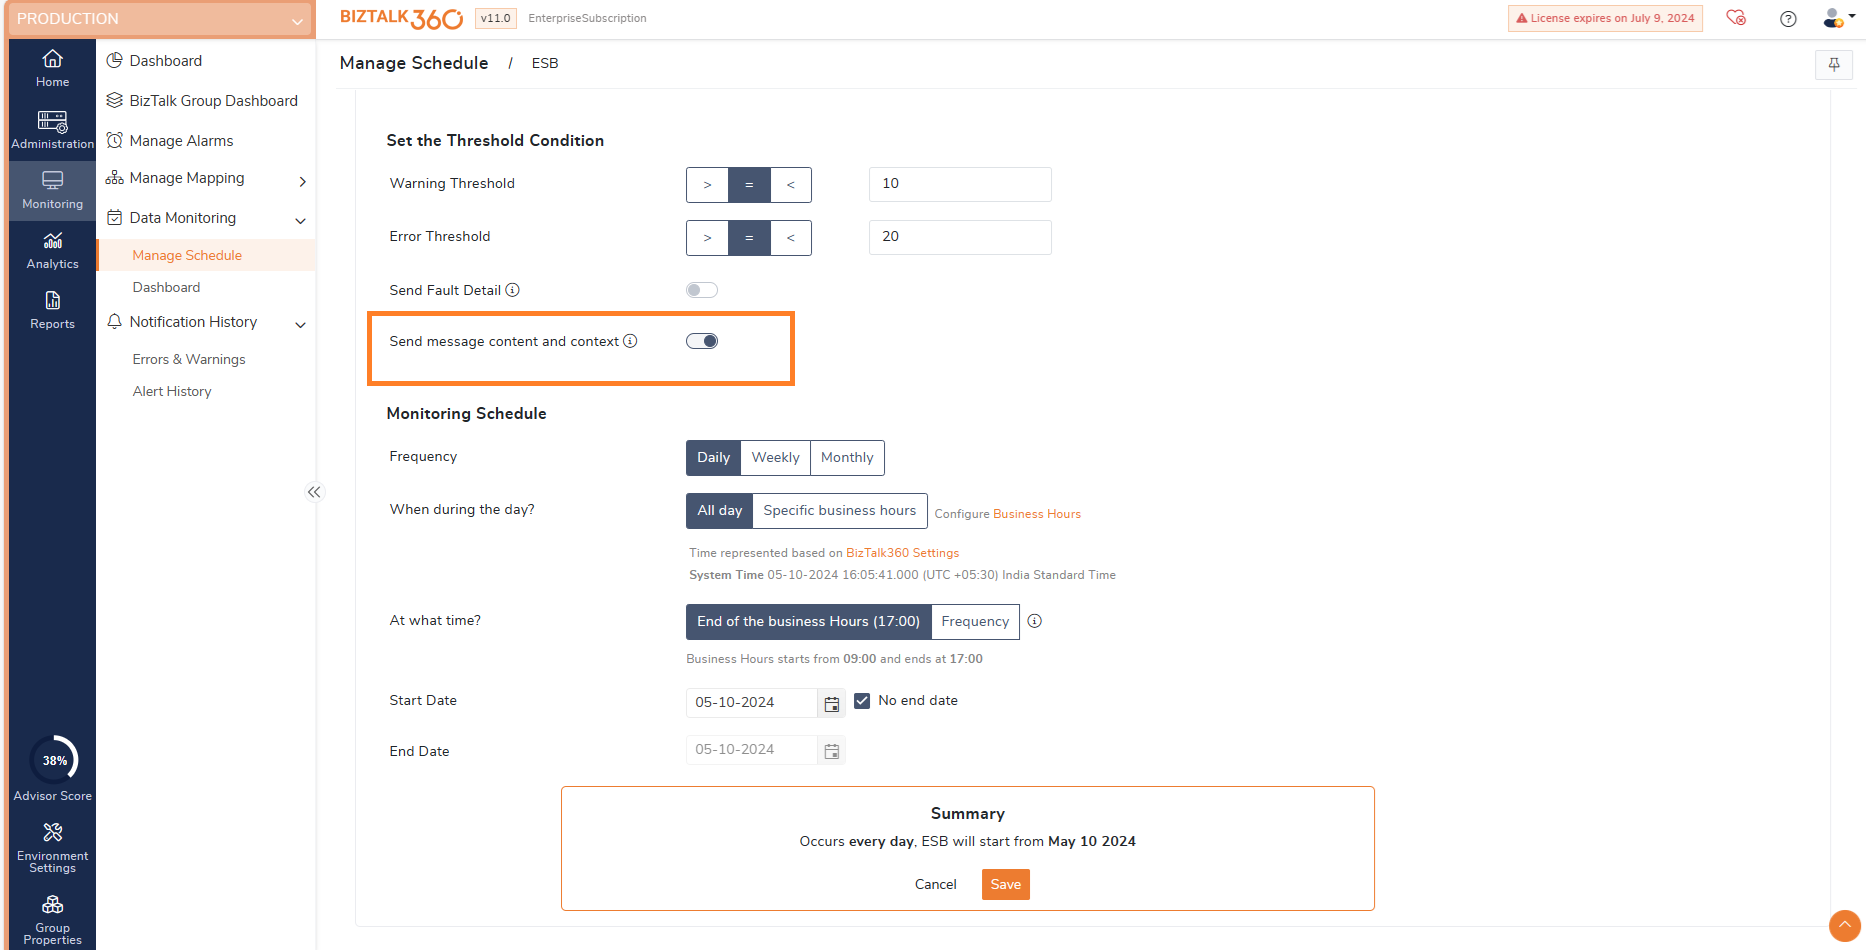
- Send Fault detail - Enable this toggle to send the fault details in the notifications sent.
- Send Message content and context - Enabling this toggle will send the message content and context in the email notifications.
- Monitoring Schedule - Select the duration of how often you want to monitor for ESB exceptions. The options are - Daily, Weekly, and Monthly. Depending on the selection, you can add further filter criteria on how often you want to monitor.
- Daily - will set up the data monitor to execute everyday
- Weekly - The data monitor will execute on the selected days of the week (Every Day, Monday-Friday, or the selected day of choice). To add a single day of the week, click the control and select the day of your choice
- Monthly - The data monitor will execute on the selected day of the month. To add a specific day of the month, enter the date in the space provided or select the date from the drop-down
If a particular day is not present in the month (say, 29th Feb), then the system will skip that month and generate the results on the specified day in the next month. The monthly Data Monitoring schedule configuration now includes an additional option called "End-of-Month." By selecting this option, the schedule will be executed at the end of the month, considering the complete month's data for monitoring purposes. - Custom - The Custom option allows you to define flexible execution ranges, such as running monitoring every 48 hours, every few days or on specific weeks of a month.
All Months: Define a recurring custom interval in hours, days, or weeks—for example, every 2 hours, every 2 days, or every 2 weeks.
Specific Months: Select a particular month and configure the occurrence, such as the first and fourth weeks of January, or patterns like the last Friday of every month or a specific week.
- When during the day - Select the time when the data monitor must execute on a particular day during business hours. You can customize your business hours by selecting the values from the Business Day Start and Business Day End option. By default, the business day start time is 9 AM and the business day end time is 5 PM. Depending on the business hour selection, the following options are available when you want the data monitor to execute on a particular day.
- At what time- Select the time when the data monitor should execute on a particular day. The options are - At the end of the business day and at a set frequency (every 1 hour or 15 minutes).
- At the end of the business day - If this option is chosen, the data monitor will execute depending on the value chosen in the Business Day End field. For e.g, if the business end time specified is 5 PM (default value), the data monitor will execute exactly at 5 PM
- Frequency - You can define specific intervals during business hours when the data monitor should execute. The options available are Minutes and Hours
- Minutes - Select the number of minutes after which the data monitor should execute. E.g., For 30 minutes means the data monitor will execute once every 30 minutes
The minimum time interval supported is 15 minutes, which means the data monitor will execute 4 times (15 minutes x 4 = 60 minutes) in an hour. - Hours - Select the number of hours after which the data monitor should execute during business hours. E.g., For 2 hours means the data monitor will execute once in 2 hours between 9 AM and 5 PM
The minimum time interval supported is 1 hour.
- Minutes - Select the number of minutes after which the data monitor should execute. E.g., For 30 minutes means the data monitor will execute once every 30 minutes
- Start and End date- You can define a date range (from a date and to a date) when you want the data monitor to execute. You can set up a data monitor to start, say, on a Monday and end on the next Tuesday. In addition to this, you can set up the other settings mentioned above in the previous steps. This means the data monitor will only start to run next Monday and will not execute after Tuesday.
- Summary - The summary information will automatically be populated based on the information selected in the previous columns.
- Save - Once all the values are selected in the previous steps, click Save to save the settings.
Send Message Content and Context
Enabling the "Send Message content and context option" in the schedule configuration allows you to attach message content and context to notification alerts. You can receive up to 50 attachments in an alert, this count can be managed under system settings->Monitoring and Notification->Maximum number of attachments in email/download.
ESB Schedule Execution Results
Once the schedules are created, it will get executed on the specified time frame. Once after the execution of schedules, it will be displayed in the data monitoring dashboard. You can go to the data monitoring dashboard and click on the respective schedule to view the data monitoring schedule execution results.
.gif)
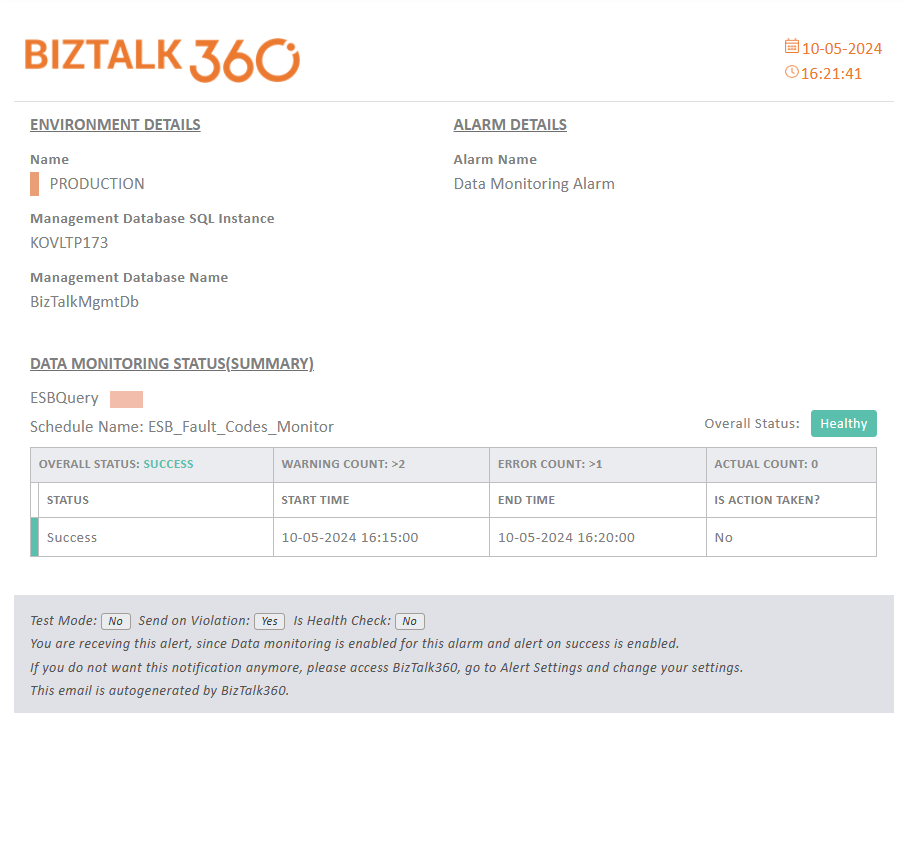
Once the ESB Data Monitor is created and configured, it will execute during the specified time intervals. The Data Monitoring dashboard will display the status of the ESB Data monitor on a specific date at a specific time interval in the calendar chart control.
Based upon how you configured your Data Monitoring alarm, emails might get triggered to the email id(s) which are specified while creating that Data Monitoring alarm.
The email alert(s) will contain the ESB Data Monitor Execution Results of the data monitor. By default, if you only selected the 'Use this alarm for Process Monitor Alerts' option, you will only receive the Failure emails to the configured email address(es). Alternatively, if you also selected the 'Notify on Success as well' option, you will receive the success alert emails as well to your mailbox. The following screenshot depicts a successful email notification received for a configured ESB Data monitor.
A link to the KB article is included in the data monitoring alert mail if the resultant service instance is already documented in KB, which helps in quickly resolving the problem. To get the link BizTalk360 hosted URL must be added in the settings->System Settings-> Data Access ->BizTalk360 Hosted URL.