In BizTalk, you might sometimes see that the performance of the server is going down or being slow. It might be because of BizTalk is in a throttling situation. The purpose of BizTalk host throttling monitoring is to notify the customers if there is any throttling occurred in their environment.
Setting up monitoring for Host Throttling
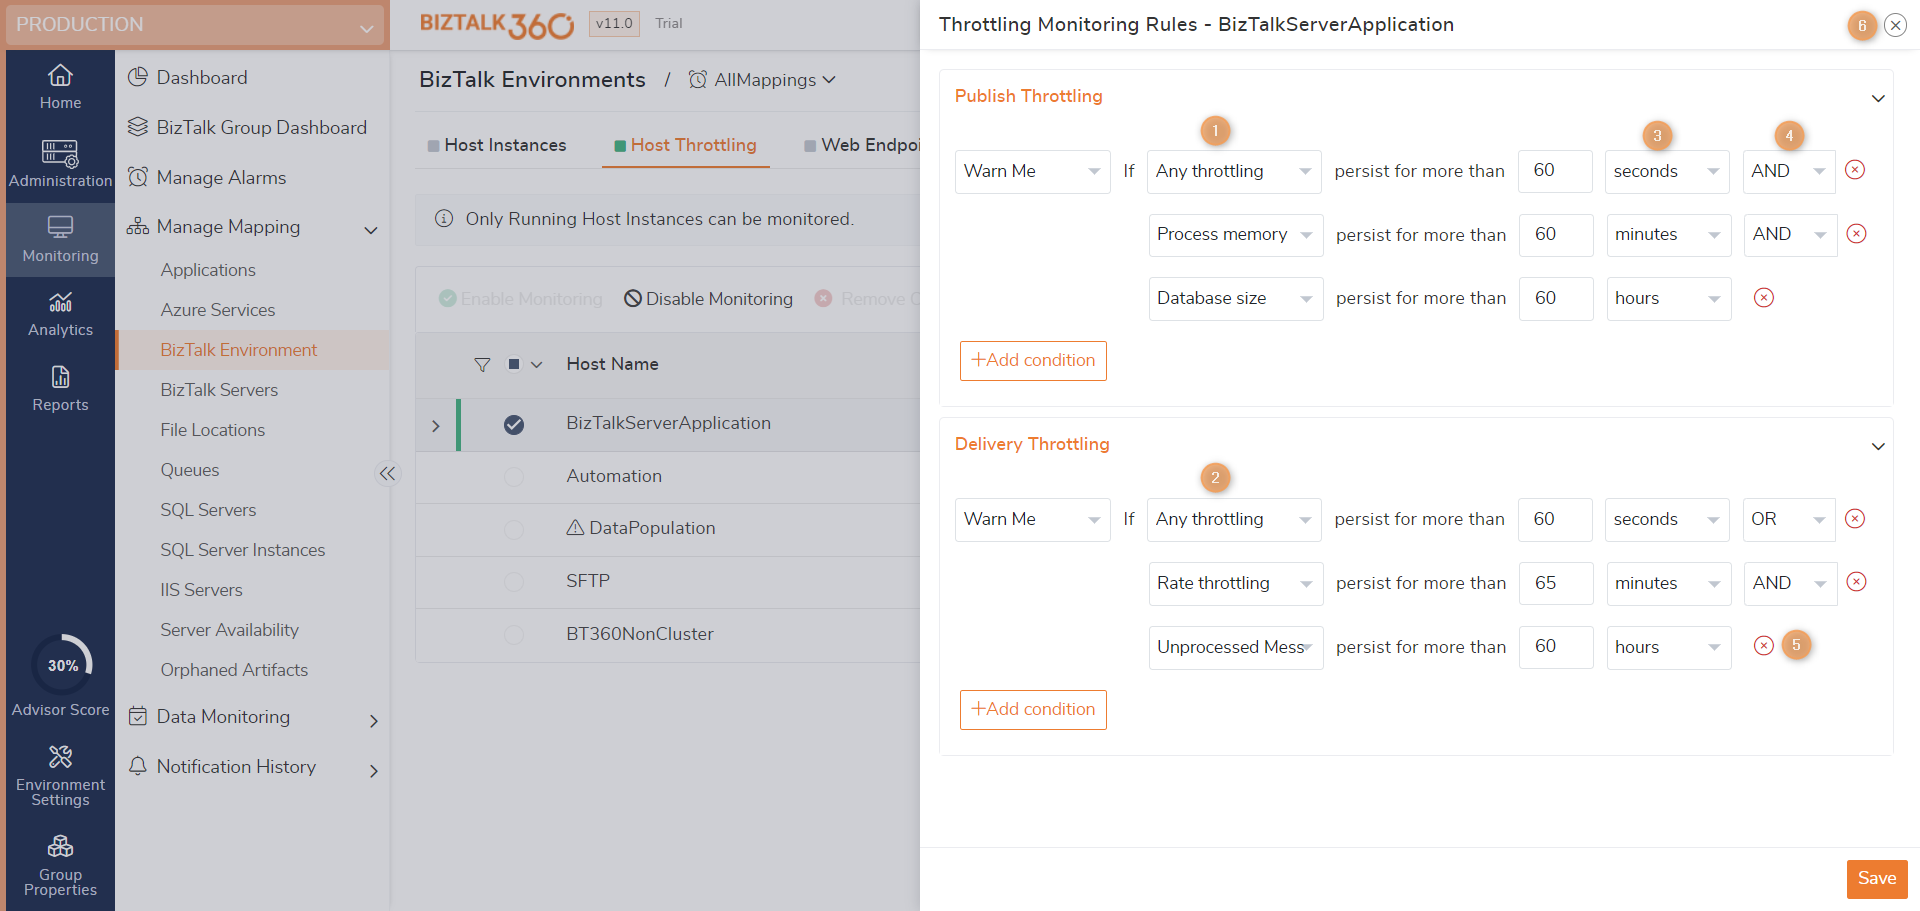
From the BizTalk Health alarm, the BizTalkServerApplication Host needs to be monitored for Throttling. In the case of Publish Throttling, a Warning should be sent in case of Rate Throttling or Process Memory Throttling. In case of Delivery Throttling, a Warning should be sent, when any throttling persists for more than 60 seconds.
An in-depth look at throttling monitoring rules configuration
In this section, we will get deep knowledge about every configuration and functionality of publishing and delivery throttling. The first step in host throttling is to create an alarm and map the alarm with the host available in the environment. Click here to understand the process of creating an alarm.
Let's say, the administrator should get notified with a warning for publishing throttling if the rate throttling or the database session throttling persists for more than 60 seconds.
In the same way, the Administrator should get notified with error information when Thread Count or User Override for Delivery Throttling persists for more than 2 minutes.
- Publish throttling- This section helps you to configure the threshold alert for Publish Host Throttling. In this case, you can configure the Throttling monitoring parameters based on the scenario mentioned above. This section has the following parameters:
- Threshold Type
- Throttling Type
- Duration
- Delivery throttling- This section helps you to configure the threshold alert for Delivery Host Throttling. In this case, you can configure the Throttling monitoring parameters based on the scenario mentioned above. This section has the following parameters:
- Threshold Type
- Throttling Type
- Duration
- Time Units - Units to find out how long it may take before thresholds are violated.
- Add Condition - Click this button to add another condition to your host throttling rule.
- Save Configurations - Helps you save the configured conditions to your host throttling monitoring rule.
- Close - Close the host throttling monitoring rules screen.
Editing the host throttling rule
BizTalk360 allows the user to modify the configured monitoring rules. You can change the throttling conditions associated with that host. For example, the user wants to add a sub-condition to the existing rule, in that case, follow the below steps:
- Click the 'Edit' button on the grid for the host which you wish to edit.
- Throttling Monitoring Rules blade window will be opened.
- Click the '+' icon and add the sub-condition with the help of the operators.
- Click 'Save' configurations to save the changes.
- Click the eye icon to view the updated sub-condition result.
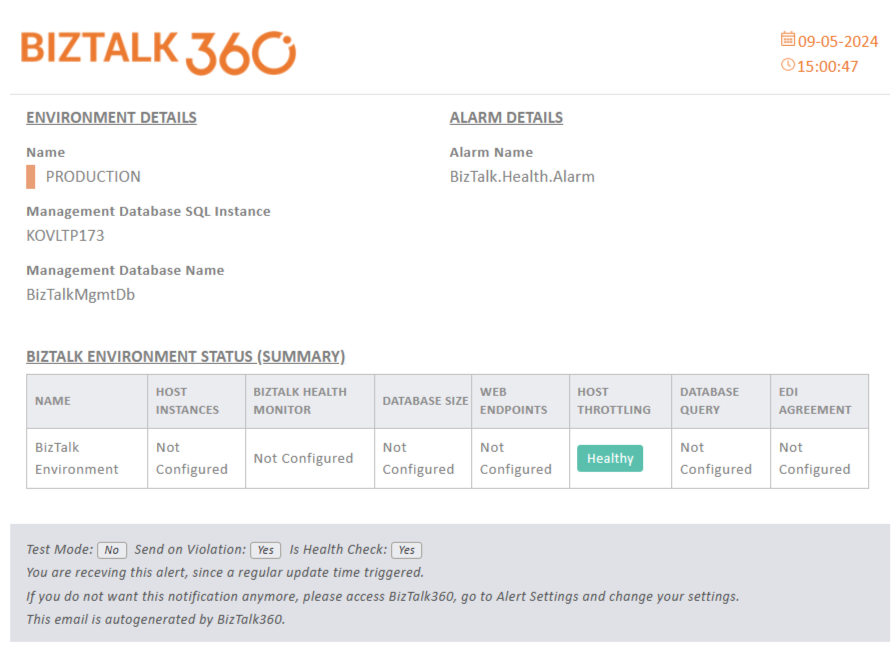
Dashboard and Notifications
Once the host throttling is enabled for monitoring, the health status of it will be shown in dashboard in a graphical tree view. If the host instance mapped is violated, it will be listed in the errors and warnings along with the associated alarms. You can also navigate to the respective host throttling on clicking them.
 In order to receive email notifications from BizTalk360 on the threshold violation alerts, you need to configure the SMTP settings under BizTalk360 Settings. Follow the steps in this article to be able to configure the SMTP settings in BizTalk360. You will receive an email notification with the exact details of the status of the host throttling.