IIS Log Monitoring enables administrators to monitor the number of IIS log entries generated for specific websites and receive alerts. This helps identify application issues, unusual traffic patterns, and recurring HTTP errors before they impact business operations.
Business Use Case
If a partner application suddenly starts sending invalid requests, resulting in numerous 400 Bad Request responses. By configuring an alert for Status Code = 400, support teams can quickly identify and resolve the issue before it affects business transactions.
Configure IIS Server
Before configuring an IIS Log Alert, make sure IIS Log Collection is enabled for the server.
You can add new IIS servers from which logs need to be collected. Refer this article.
Navigate to Environment Settings > IIS Log Collection.
Add the required IIS servers.
Enable logging for the websites that need to be monitored.
Configure log collection filters such as Status Code, Method, Port, and URI.
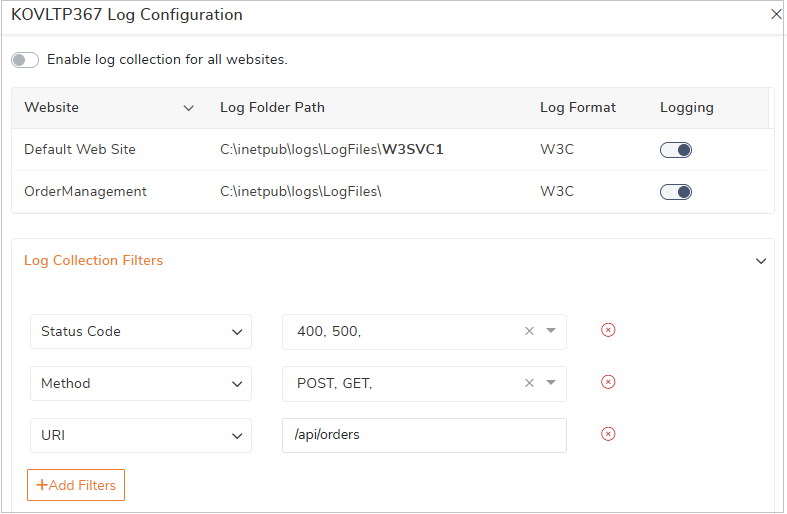
IIS Log monitoring configuration
Navigate to Monitoring > Manage Mapping > IIS Servers > Logs.
Click New IIS Log Alert.
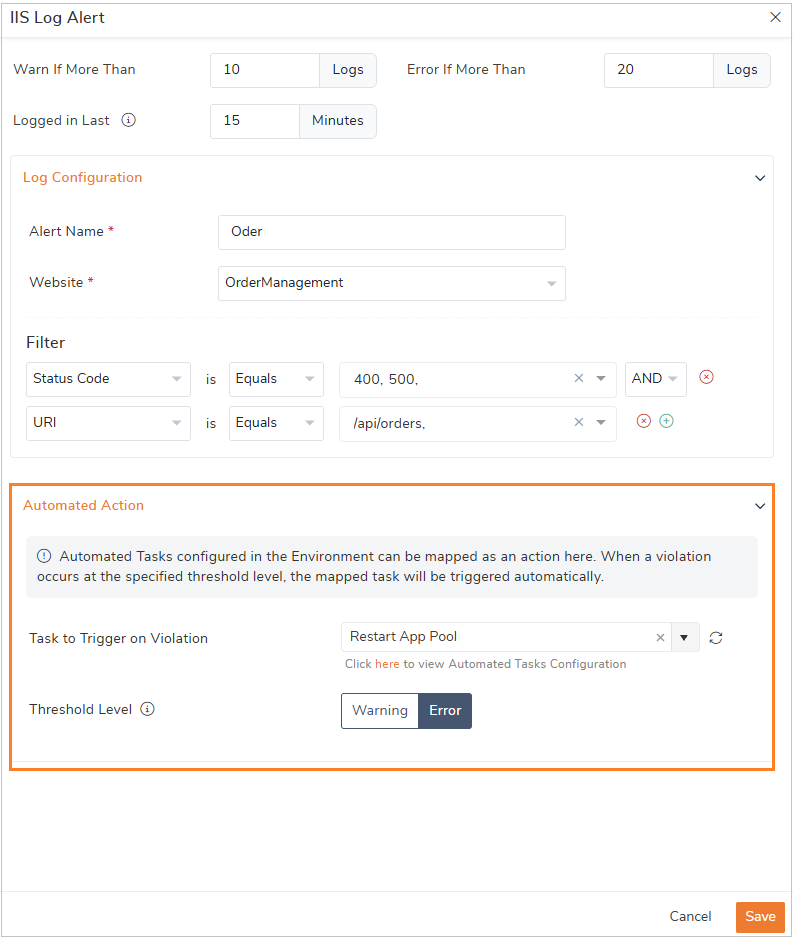
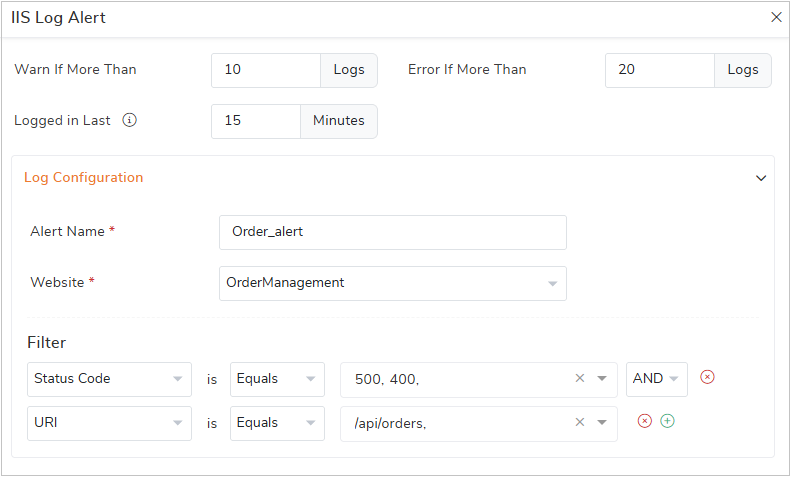
In the configuration blade, update the Threshold rules with Warning and error conditions .
Example: Warn If more than 10 Logs , Error if More than 20 errors.
If more than 10 matching log entries are generated during the configured time period, a Warning alert is raised. If the count exceeds 20 log entries, an Error alert is raised.
4. Logged in Last - Specify the time window during which the logs should be evaluated.
Example: Logged in Last 15 Minutes.
This means BizTalk360 checks the number of matching log entries generated in the last 15 minutes.
5. Log Configuration
Alert Name -Provide a meaningful name for the alert.( IIS 400 Errors - Order API)
Website-Select the website that you want to monitor.
6. Filter : Filters allow you to narrow down the IIS log entries that should be monitored. You can configure one or more of the following filters:
• Status Code – Filter logs based on HTTP response codes such as 200, 400, 404, or 500.
• Method – Filter logs based on HTTP methods such as GET, POST, PUT, DELETE, etc.
• URI – Filter logs for specific application endpoints. The URI filter works as a Contains operation.
• Client IP – Filter logs generated from a specific client IP address.
• Username – Filter logs for requests made by a particular authenticated user.
Example : To monitor only specific endpoint “ Order API”. Configure as below
• Website: OrderManagementAPI
• URI: /api/orders
• Error Threshold: 50 logs in 15 minutes
If more than 50 matching log entries are generated for the /api/orders endpoint within 15 minutes, BizTalk360 raises an alert, enabling administrators to investigate potential application issues.
Automated Action
You can map an Automated Task to the alert. When the configured threshold is violated, the mapped task is triggered automatically.
Examples of automated actions include:
Executing PowerShell scripts
Restarting IIS application pools
Restarting BizTalk applications/artifacts
Use Case : Assume that the OrderManagementAPI website starts generating more than 50 HTTP 500 .BizTalk360 can automatically trigger a task to:
Restart the corresponding IIS Application Pool, or
Restart the associated BizTalk application or artifact.
This automated recovery action can restore the service quickly, reducing downtime and minimizing the impact on business users and partner integrations.