Creating Custom Widgets
In this article, we will take a comprehensive look at the steps involved in adding a Custom Widget to the Administration dashboard. In BizTalk360, users can create custom widgets and associate them with their dashboard. Through the custom widget, the user can (for example) integrate the BizTalk360 API, and third-party APIs (like Salesforce, Power BI, and Azure, etc.), and create the database queries by using Secure SQL Queries.
Follow the steps as shown below to create a custom widget and pin it to the Administration dashboard. This will enable the operations team to monitor required activities from the dashboard.
Log in to BizTalk360
Select the environment from the environmental panel.
On the Administration screen, click Add Widget
In the Add/Remove Widget blade, scroll to the end and Click Add Custom Widget.
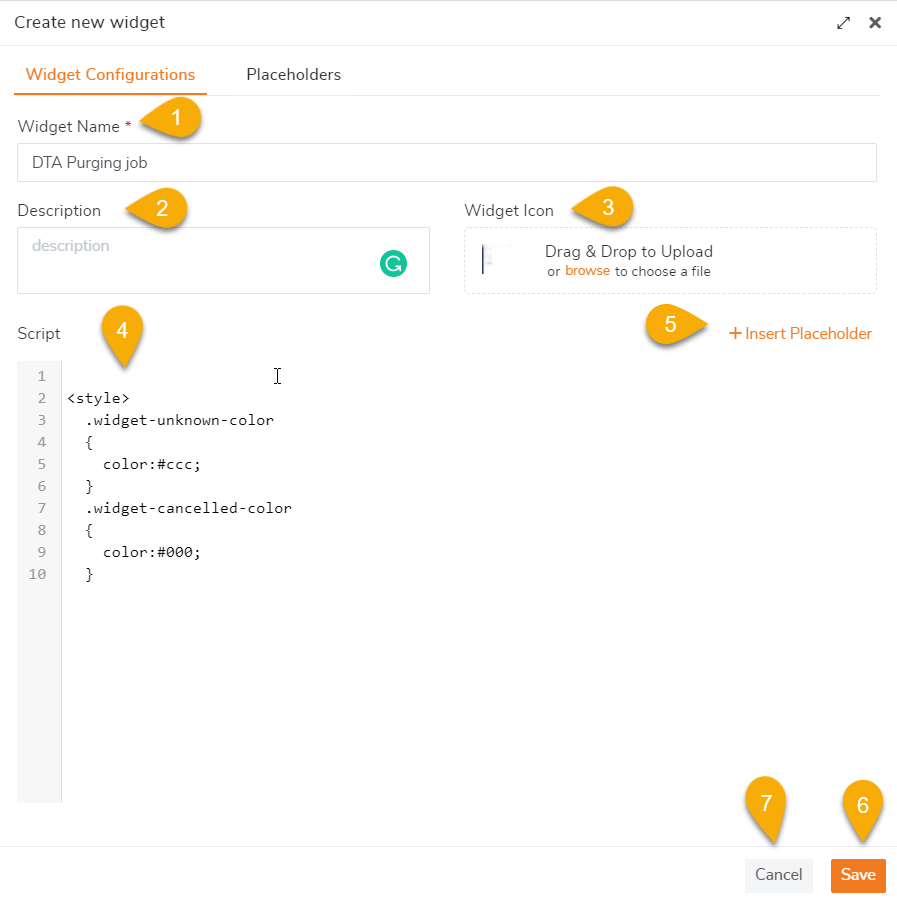
The Add New Custom Widget blade will request the basic configuration details like:
Widget Name - Enter a friendly name that helps to identify the custom widget. Ex. DTA Purging Job
Description - Enter a short description of the widget.
Widget Icon - This section allows the user to add a logo for the custom widget.
Script - Type the script into the space provided.
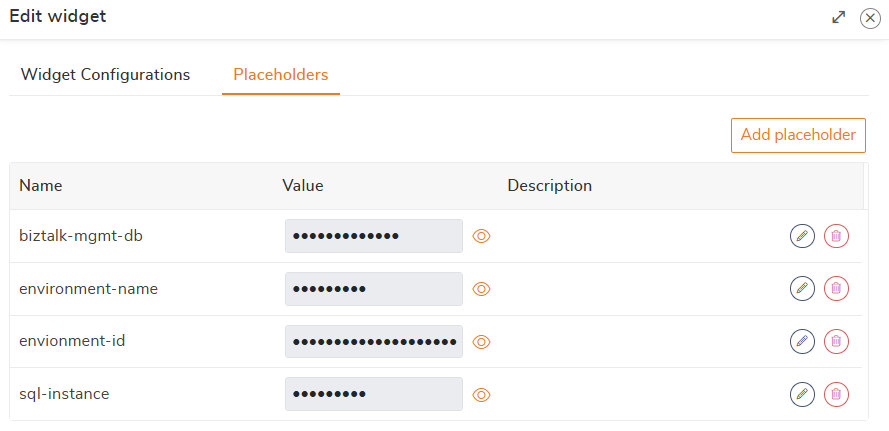
Insert Placeholder
While working with API integrations, there may be scenarios where credentials (such as username, password) or other confidential details are required. Instead of hardcoding such information, it is recommended to define them as placeholders and refer to them within the code.
Additionally, many widgets often use the same values like styles, variables, or configuration settings. To avoid repeating them and make updates easier, users can create and utilize placeholders. For example, values like the environment ID and SQL instance name can be set as placeholders. This makes the code cleaner, reusable, and consistent across different custom widgets that use similar values.
Save - Click Save to store the custom widget configuration.
Cancel - Click Cancel to cancel the custom widget creation process.
Supported Languages and Frameworks in Custom Widgets
The BizTalk360 Custom Widgets Script Editor supports the use of the following front-end technologies:
HTML & CSS
HTML is supported in custom widgets to structure the content and layout. It helps in building the visual representation of the widget, such as tables, charts, or displaying text, making it easy to present data in a user-friendly way. CSS can be used to style and format the widget, allowing users to adjust the appearance, layout, and responsiveness.
Example: Basic HTML Structure for a Custom Widget
<div class="widget-container">
    <h3>Simple Text Widget</h3>
    <p>HTML is supported in BizTalk360 custom widgets to structure the content and layout.</p>
</div>

<style>
    .widget-container { padding: 15px; border-radius: 5px; background: #f9f9f9; box-shadow: 0 2px 4px rgba(0,0,0,0.1); }
    h3 { font-size: 18px; color: #333; }
    p { font-size: 14px; color: #555; }
</style>
JavaScript
Custom widgets support JavaScript for implementing business logic, manipulating the DOM, handling user interactions, and integrating with REST APIs. It can be used to build dynamic, interactive widgets by fetching data from BizTalk, BizTalk360 internal services, or any other internal or external sources, and rendering them through various visual elements.
Calling a Sample API and Storing the Response
The following example demonstrates how to:
Call a REST API using
fetchorXMLHttpRequestParse the JSON response
Store the response in a variable
Display part of the data inside the widget
<script>
    document.getElementById('refreshButton').addEventListener('click', function() {
        loadEnvironmentData();
    });

    function loadEnvironmentData() {
        const url = 'http://localhost/Kovai.BizTalk360.Src/Services.REST/AdminService.svc/GetAllConfiguredEnvironments';

        fetch(url, { credentials: 'same-origin' })
            .then(response => response.json())
            .then(data => {
                if (data.success) {
                    // Further logic to handle the response
                }
            })
            .catch(error => console.error("API call failed:", error));
    }
</script>

<button id="refreshButton" class="btn btn-link primary">
    <i class="fal fa-sync-alt"></i> Get Data from API
</button>
Bootstrap
Bootstrap classes are pre-defined CSS styles that help quickly style elements and make the widget responsive. They provide layout control, typography, and utilities, widely used in front-end development. Users can apply these Bootstrap classes in custom widgets to efficiently style elements, manage layouts, and ensure responsiveness, like the following:
container: Defines a responsive fixed-width container.row: Creates a horizontal group of columns.col-12: Specifies a column that spans the full width of the container.btn: Applies default button styling.table: Styles the table with borders and padding.
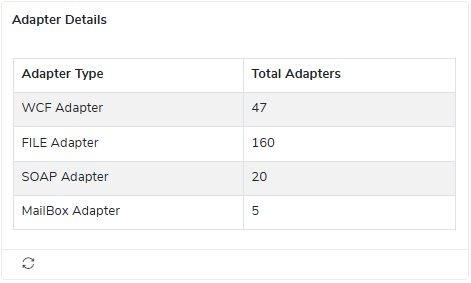
Example: Displaying Adapter Counts in a Table with Bootstrap
<div class="row mt-4">
    <div class="col-12">
        <div class="table-responsive">
            <table class="table table-bordered table-striped">
                <thead class="thead-dark">
                    <tr>
                        <th scope="col">Adapter Type</th>
                        <th scope="col">Total Adapters</th>
                    </tr>
                </thead>
                <tbody>
                    <tr>
                        <td>WCF Adapter</td>
                        <td>wcfAdapterCount</td>
                    </tr>
                    <tr>
                        <td>FILE Adapter</td>
                        <td>fileAdapterCount</td>
                    </tr>
                    <tr>
                        <td>SOAP Adapter</td>
                        <td>soapAdapterCount</td>
                    </tr>
                    <tr>
                        <td>MailBox Adapter</td>
                        <td>mailBoxAdapterCount</td>
                    </tr>
                </tbody>
            </table>
        </div>
    </div>
</div>
Here’s a sample view of the Adapter count details widget in tabular format.
Highcharts
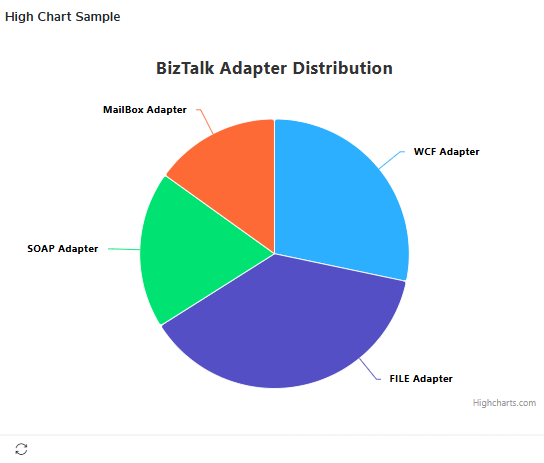
Highcharts is a JavaScript library that enables the creation of interactive and visually engaging charts. It supports various chart types such as line, pie, and bar. In custom widgets, user can leverage Highcharts to dynamically visualize data, making it easier to track trends, compare data, and present insights in a clear and visually appealing manner.
Example: Pie chart to visualize the number of adapters.
<div id="pie-chart" style="width:100%;height:400px;"></div>
<script>
    // Assume the data below is dynamically fetched from an API
    Highcharts.chart('pie-chart', {
        chart: {
            type: 'pie'
        },
        title: {
            text: 'BizTalk Adapter Distribution'
        },
        series: [{
            name: 'Adapters',
            colorByPoint: true,
            data: [{
                name: 'WCF Adapter',
                y: 15
            }, {
                name: 'FILE Adapter',
                y: 20
            }, {
                name: 'SOAP Adapter',
                y: 10
            }, {
                name: 'MailBox Adapter',
                y: 8
            }]
        }]
    });
</script>
Here’s a sample view of the Adapter count details in a chart format.
Font Awesome
Font Awesome provides vector icons that can be used across different platforms. User can easily add icons to the widgets to enhance UI clarity and interactivity.
Example: Using Font Awesome Icons
<i class="fal fa-cogs"></i> Settings<br>
<i class="fal fa-user"></i> User<br>
<i class="fal fa-server"></i> Server<br>
<i class="fal fa-database"></i> Database<br>
<i class="fal fa-sliders-h"></i> Configuration<br>
Sample Custom Widget
Let's take a quick look at a real-world use case: Visualizing the status of SQL jobs: In many systems, SQL jobs are used to automate tasks such as database maintenance, backups, and data processing. Displaying their success or failure in an easy-to-understand way helps in quickly assessing the overall health of the system's automated processes.
In this case, we can use BizTalk360 API to retrieve the history of all SQL Jobs.
The below code retrieves SQL job status data from the GetSqlJobsHistory() API and binds it to a Highcharts donut chart. It uses placeholders (like environment ID, SQL instance name and etc.) to make the widget reusable across other APIs.
<!DOCTYPE html>
<html lang="en">
<head>
<style>
#pie-chart { width: 100%; height: 400px; }
</style>
</head>
<body>
<div id="pie-chart"></div>
<script>
document.addEventListener("DOMContentLoaded", function () {
const url = 'http://localhost/BizTalk360/Services.REST/BizTalkGroupService.svc/GetSqlJobsHistory';
const payload = {
filter: { jobNames: [], runStatus: [] },
sqlInstanceName: "sql-instance_041475",
maxMatches: "100",
context: {
callerReference: "REST-SAMPLE",
environmentSettings: {
id: "`envionment-id_765128`",
name: "`environment-name_374661`",
mgmtDbName: "`biztalk-mgmt-db_849302`",
mgmtDbSqlInstanceName: "`sql-instance_041475`",
licenseEdition: 5
}
}
};
// Make the POST request to fetch SQL job history data
fetch(url, {
method: 'POST',
headers: {
'Content-Type': 'application/json'
},
body: JSON.stringify(payload)
})
.then(response => response.json())
.then(data => {
if (data.success) {
processData(data.sqlJobsHistoryList);
} else {
console.error("Failed to fetch data:", data);
}
})
.catch(error => console.error("Error fetching data:", error));
// Function to process and display the data in a donut chart
function processData(jobsHistory) {
// Initialize counters for each status type
let succeeded = 0, failed = 0, unknown = 0, canceled = 0, ignore = 0;
// Process each job and count the status occurrences
jobsHistory.forEach(job => {
switch (job.runStatus) {
case 0: succeeded++; break; // Succeeded
case 1: canceled++; break; // Canceled
case 2: failed++; break; // Failed
case 3: unknown++; break; // Unknown
case 4: ignore++; break; // Ignore
default: unknown++; break;
}
});
// Set up the data for the chart
const chartData = [
{ name: 'Succeeded', y: succeeded, color: '#36b37e' },
{ name: 'Failed', y: failed, color: '#d32f2f' },
{ name: 'Unknown', y: unknown, color: '#eec200' },
{ name: 'Canceled', y: canceled, color: '#808080' },
{ name: 'Ignore', y: ignore, color: '#808080' }
];
// Create the donut chart using Highcharts
Highcharts.chart('pie-chart', {
chart: {
type: 'pie'
},
plotOptions: {
pie: {
innerSize: '60%',
dataLabels: {
enabled: true,
format: '{point.name}: {point.y}'
}
}
},
series: [{
name: 'Job Status',
colorByPoint: true,
data: chartData
}]
});
}
});
</script>
</body>
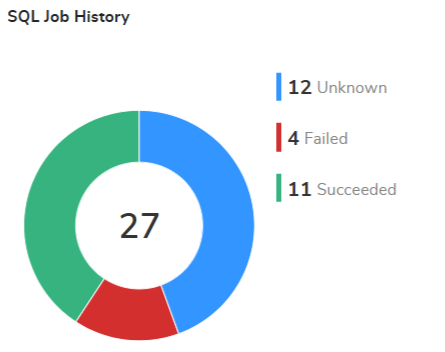
</html>Here’s how the widget looks like: it displays a donut-style chart that visually represents the status of SQL jobs, with color-coded sections for each job status. The chart is clean and easy to read, showing the count of each status, such as Succeeded, Failed, Unknown, Canceled, and Ignore.
Similarly, users can create custom widgets to present meaningful insights by leveraging various BizTalk360 APIs or integrating with external APIs. These widgets can be tailored to show data like messages processed, environment health, or third-party metrics—helping teams monitor key operations in real time.